0.02, 0.1, 0.33, 0.5, 0.77, 0.8, 0.9, 0.98, 0.99, and 1.0, includ-
ing the optimal exponent values were analyzed. The combina-
tion of
τ
CLP
and
τ
CMP
are respectively referred to as tau1, tau2,
…, tau13, which are represented as value of 1, 2, …, 13 on the
X axis in Figure 9. When
τ
CLP
= 0,
τ
CMP
= 1,
P
k
IMC
(
V
m
) =
P
k
CMP
(
V
m
),
which means
CMP
alone determined the fused probability, and
CLP
did not impact the upscaling. If
τ
CLP
= 1,
τ
CMP
= 0,
P
k
IMC
(
V
m
)
=
P
k
CLP
(
V
m
), then
CLP
alone determined the fused probability.
Except for these two special situations, the ratio between
τ
CLP
and
τ
CMP
was in the range of [1/99, 99], which shows the dif-
ferent effects of
CLP
and
CMP
on the
FMC
algorithm.
The OCs in Figure 9 were used to compare the perfor-
mance of
FMC
using the different exponent values. The overall
consistency tended to increase for a relatively coarse resolu-
tion (larger than 120 meter in this paper) when increasing
the contribution of
CLP
(decreasing the contribution of
CMP
)
(Figure 9). This trend was especially true for the heteroge-
neous areas (e.g.,
ASD
1810,
ASD
1830 and
ASD
1870), and less so
in the homogeneous areas (e.g.,
ASD
4530,
ASD
4550,
ASD
4580).
For example, when upscaling the coarse map to 960 meter
resolution, the
OC
increased about 7.93 percent in
ASD
1810,
while only about 0.34 percent in
ASD
4530. These results dem-
onstrate that upscaled maps in heterogeneous areas benefits
more from increasing the contribution of
CLP
when compared
to the homogenous areas, especially for the coarsest resolu-
tion maps.
Additionally, for the relatively finer-resolution, upscaled
maps (e.g., 60 meter, 90 meter and 120 meters), the
OC
shows
less increase when increasing the contribution of
CLP
(Fig-
ure 9). For example, with increasing the contribution of
CLP
,
the
OC
increases about 0.95 percent at 60 meter resolution
in
ASD
1810. These results imply that changing the exponent
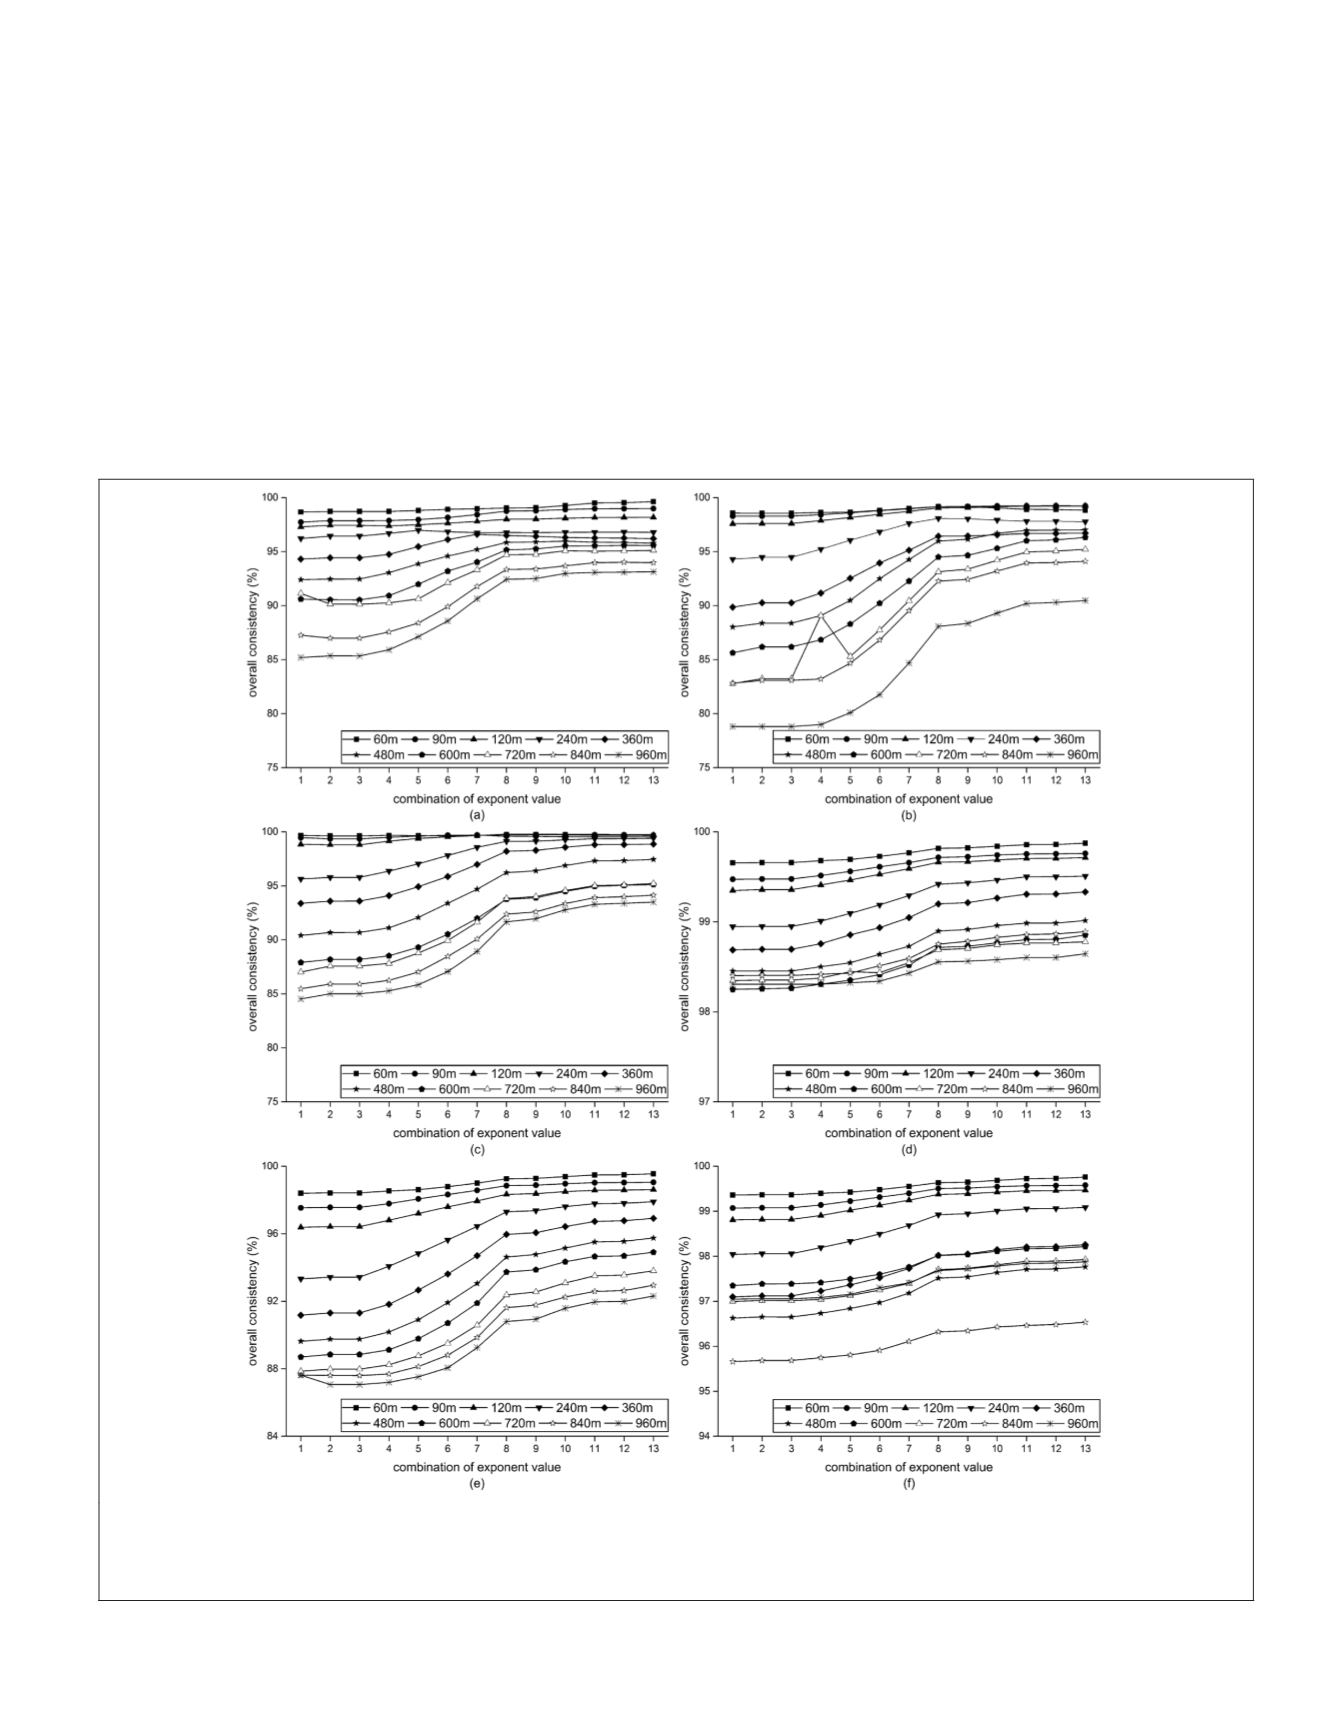
Figure 9.
OCs
derived from
FMC
using a series of the selected exponent values at different coarse maps ranging from 60 meters to
960 meters: (a), (b), (c), (d), (e), and (f) are the results of
ASD
1810,
ASD
1830,
ASD
1870,
ASD
4530,
ASD
4550,
ASD
4580, respectively.
The values at X axis represents different exponent values:
τ
CLP
= 0, 0.01, 0.02, 0.1, 0.33, 0.5, 0.77, 0.8, 0.9, 0.98, 0.99, and 1,
respectively. The higher X value means higher contribution from
CLP
to determine the class type of pixels at the coarse maps.
PHOTOGRAMMETRIC ENGINEERING & REMOTE SENSING
February 2018
97


