of cavities corresponding to some unmatched pixels, as
shown in Figure 9a. Therefore, a regional matching propaga-
tion is designed to facilitate dense matching in the cavities.
For the regional matching propagation, the previous
segmentation result is used to check whether an unmatched
pixel in a cavity in one image is located in any segment. If the
pixel is located inside a segment, the interpolated disparity
from the disparity plane is used to predict a candidate match
in the other image, and the matches will be searched within
a range along the epipolar line, as previously described. If
the pixel is not located inside any segment, its disparity will
be estimated based on a clustering analysis of the disparities
of existing matches within a buffer region. In this case, the
disparity estimation is implemented as follows:
1. For each unmatched pixel
P
, the existing matches are
searched within a buffer surrounding region, and their
disparities are classified using the k-means algorithm
(MacQueen, 1967);
2. The statistical feature of each disparity cluster is analyzed.
For each cluster, the mean value
–
d
j
and the standard devia-
tion
s
j
are calculated (
j
represents the
j
th
cluster);
3. To match pixel
P
, the disparity range (
–
d
j
– 2·
s
j
,
–
d
j
+ 2·
s
j
) is
searched to find the most possible match for each cluster
P'
j
with the maximum correlation coefficient
CC
j
;
4. The status of the correlation coefficient with regard to the
threshold is checked. If no
CC
j
passes the threshold, the
pixel
P
is not matched. If only one
CC
j
passes the threshold,
pixel
P
is matched with
P'
j
. If more than one
CC
j
passes the
threshold, the pixel with the highest
CC
j
is selected.
Following local and regional dense matching propagation, all
pixels in an image have been checked for possible matches and
all of the regions that could not be matched have been isolated.
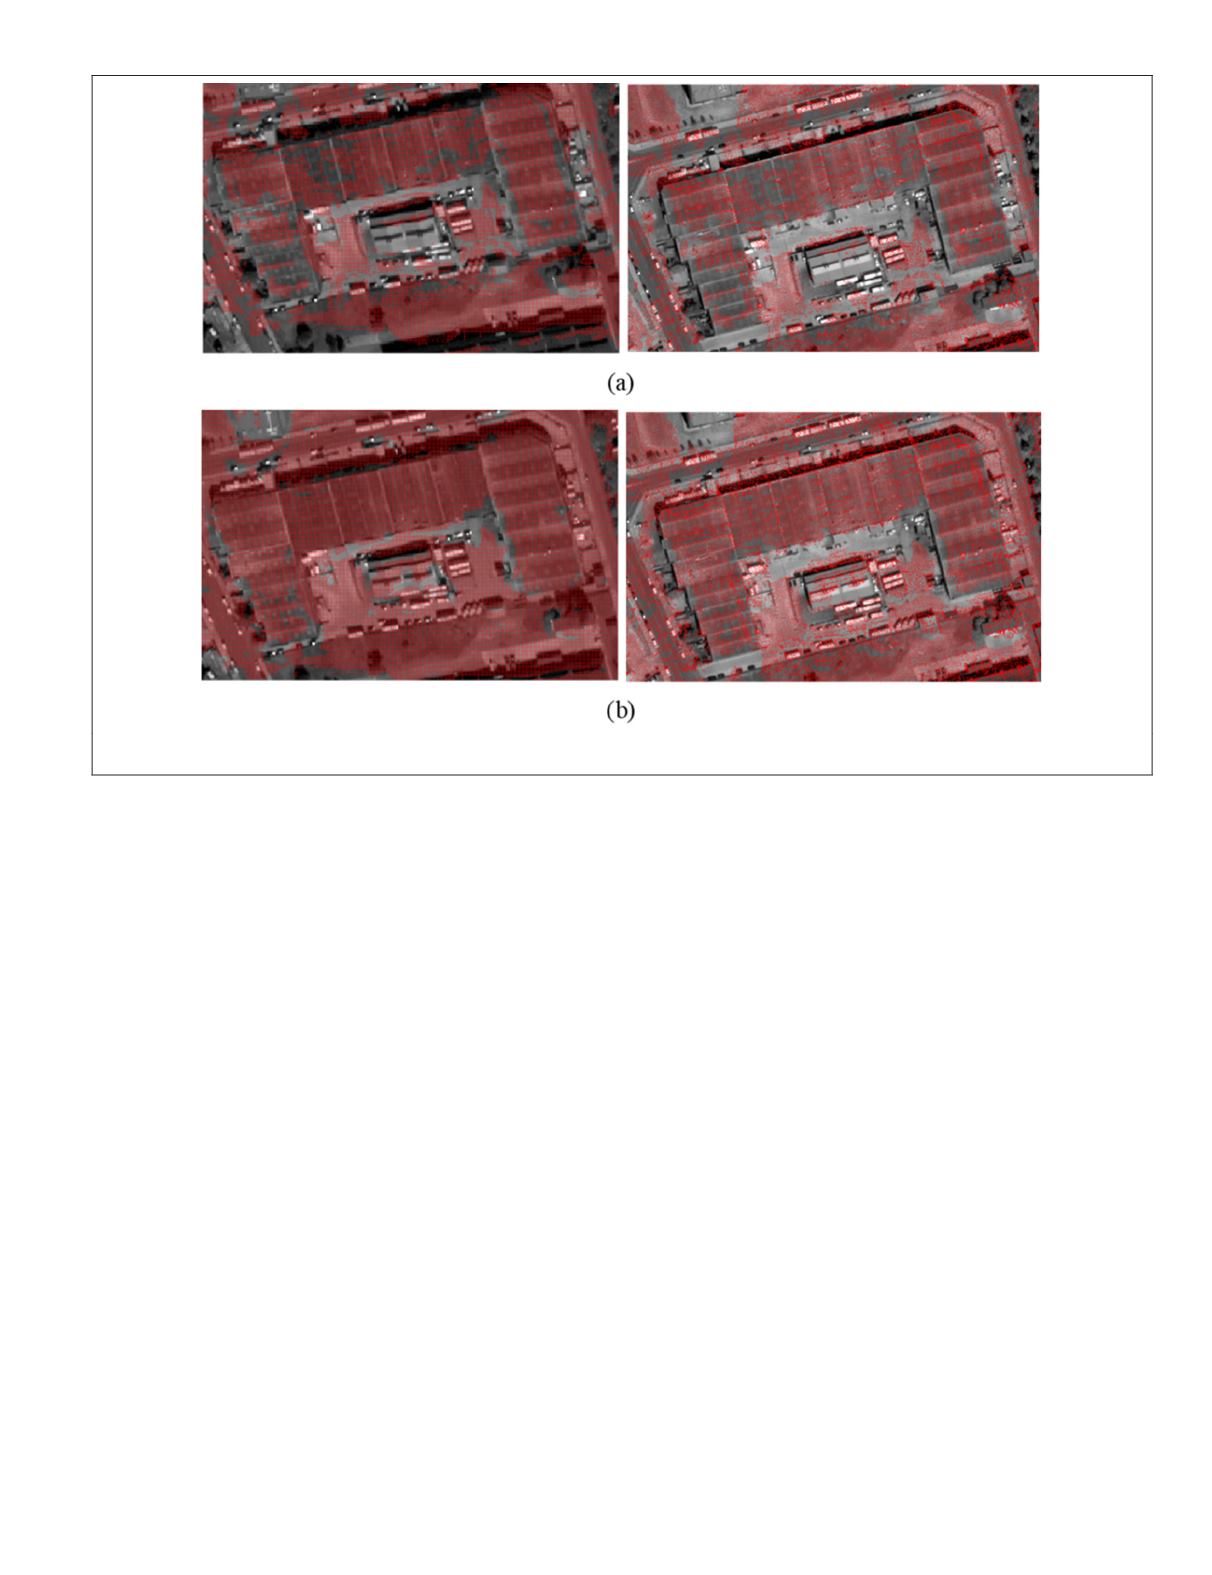
Figure 9 shows an example of the regional matching propaga-
tion results for the same area of Figure 9a. Here, the regional
matching propagation effectively matched the pixels in the
cavities. Although a few regions in Figure 9b remain without
matches, these are mainly attributable to issues such as occlu-
sion, moving objects, or insufficient textural information.
Experimental Analysis
To evaluate the proposed approach, we conducted an experi-
mental analysis of two sets of high-resolution images, each
representing a different urban type. The first set comprised
aerial images of Vaihingen, Germany that were selected from
ISPRS benchmarks, and the second set is a pair of Pleiades-1
satellite images of Hong Kong.
After image matching, 3D point clouds can be obtained
using a photogrammetric space intersection based on the
pin-hole camera model (for aerial images) or the rational
polynomial coefficient (
RPC
) model (for satellite images). The
generated 3D point clouds were evaluated in terms of their
geometric accuracy and other aspects (e.g., point density
and distribution) and subsequently compared with 3D point
clouds from the airborne lidar data. During the quantitative
evaluation, the 3D coordinates of the generated point clouds
were shifted to the reference airborne lidar point cloud to en-
sure that the evaluation was not biased by possible errors in
the image orientation parameters and the lidar point cloud it-
self. To compare the photogrammetric and lidar point clouds,
a 3D triangulated mesh model was generated first from the
photogrammetric point cloud, and a new set of heights of the
lidar points were interpolated from the 3D mesh model. They
were then compared with the corresponding heights of the
lidar points, and their signed differences were computed. The
Figure 9. Examples of dense matching propagation performances: (a) Local matching propagation, and (b) regional matching
propagation.
PHOTOGRAMMETRIC ENGINEERING & REMOTE SENSING
March 2018
143


