root-mean-square-error (
RMSE
) and standard deviation (
STD
)
values of the signed differences were calculated. Similarly, 3D
point clouds were obtained from the matching results gener-
ated by
SGM
and were also compared with those from the
proposed approach.
Experiment Based on Aerial Images of Vaihingen, Germany
The first data set of images captured over Vaihingen, Germany
was obtained from the ISPRS 3D Building Reconstruction
Benchmark. The images had a ground sampling distance of 8
cm (above-ground flying height: 800 m, focal length: 120 mm, 65
percent forward lap, 60 percent side lap) and were taken with
an Intergraph/ZI DMC camera. To investigate the performance of
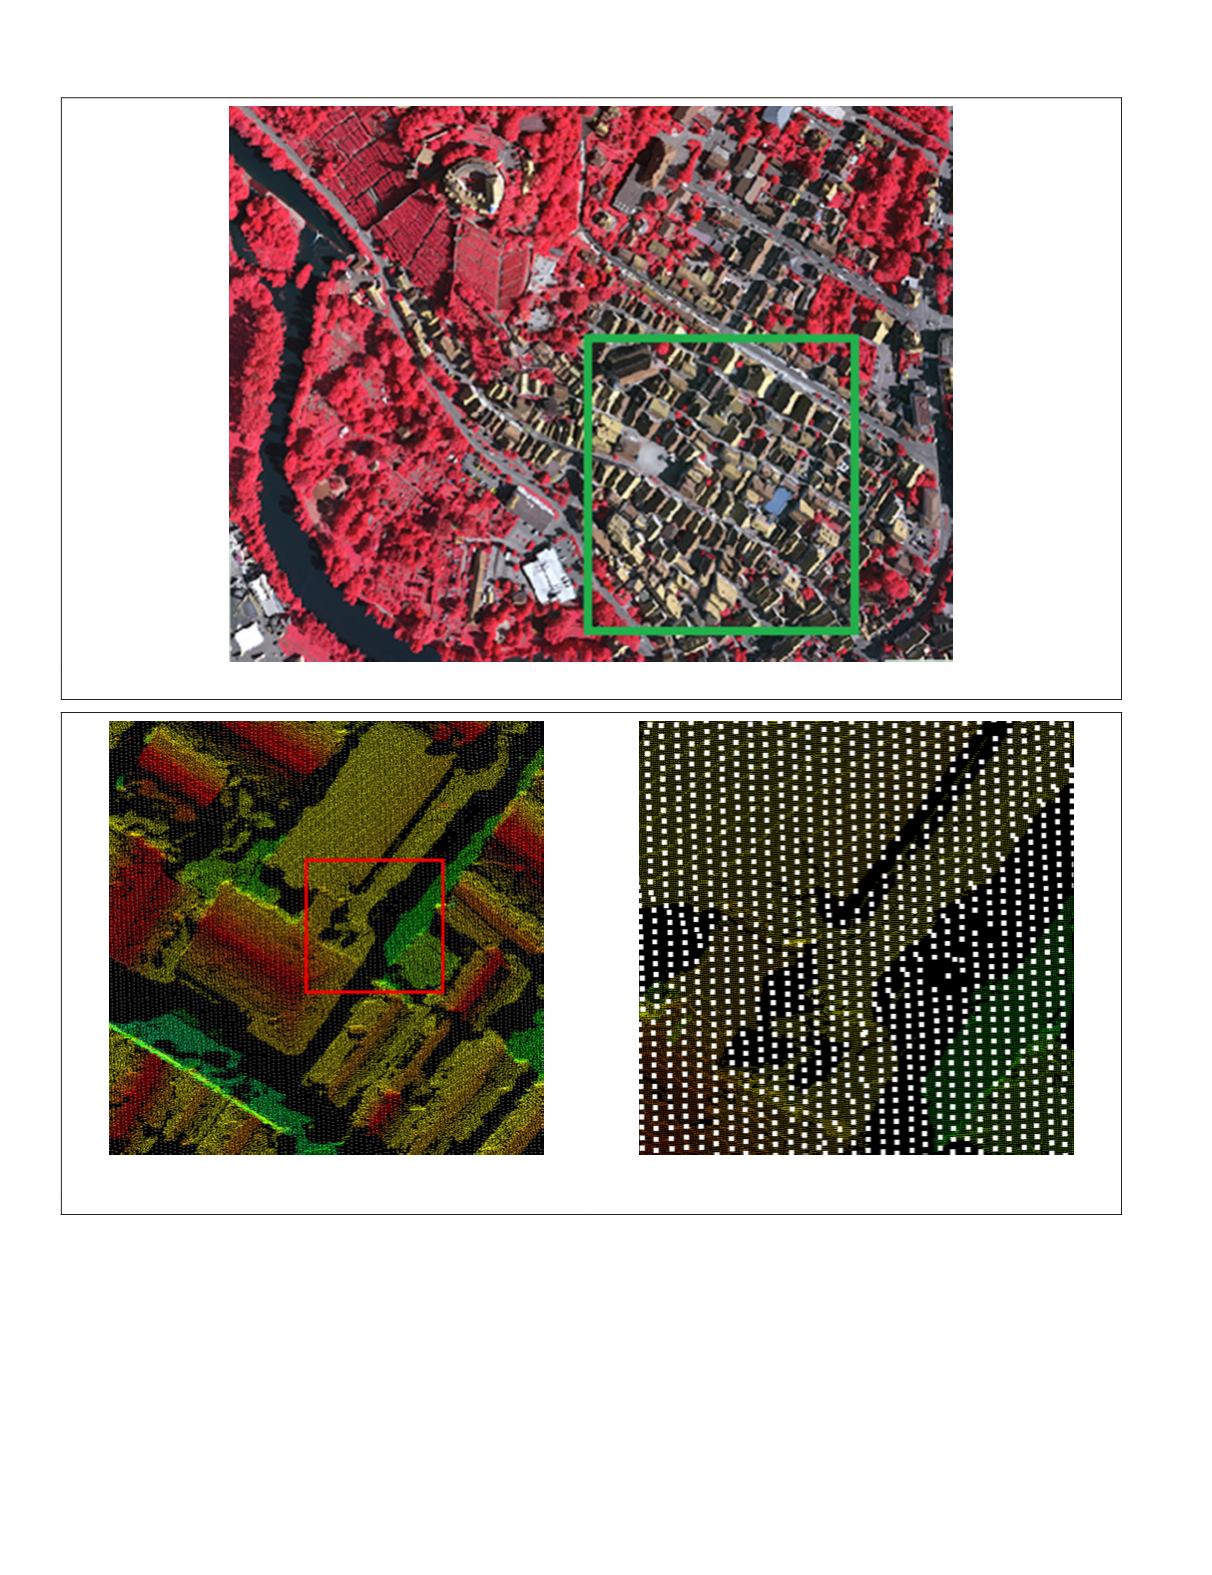
the approaches in urban areas, a built-up region (the rectangle in
Figure 10) was selected for the experimental analysis.
The reference dataset used in this experiment was a 3D
point cloud generated from airborne laser scanning data. They
were acquired using a Leica
ALS50
system with a 45° field-of-
view and a mean above-ground flying height of 500 m. The
average strip overlap is 30 percent, and the point density var-
ies between 4 and 7 pts/m
2
.
Figure 11a shows part of the point clouds generated using
the proposed
SATM
+ method (colored small dots) and lidar
(white square dots). For some regions (e.g., near the buildings),
SATM
+ could not produce 3D points, whereas the lidar points
Figure 10. Aerial image of Vaihingen, with the study area marked by a rectangle.
(a)
(b)
Figure 11. Comparison of point clouds generated for the aerial images of Vaihingen, Germany.
144
March 2018
PHOTOGRAMMETRIC ENGINEERING & REMOTE SENSING


