are evident. As these regions are occluded, no matches can
be generated by image matching. In other areas,
SATM
+ could
generate more dense 3D point clouds relative to the lidar data.
Figure 11b is a higher-magnification view of the box in Figure
11a. The lidar points (in white) are enlarged seven-fold for
better visualization. Here, the point density obtained by
SATM
+
is clearly much higher than the
lidar data. The statistics indicate
that on average, the density of the
point clouds obtained by
SATM
+ is
approximately 13 times higher than
that of the lidar point clouds.
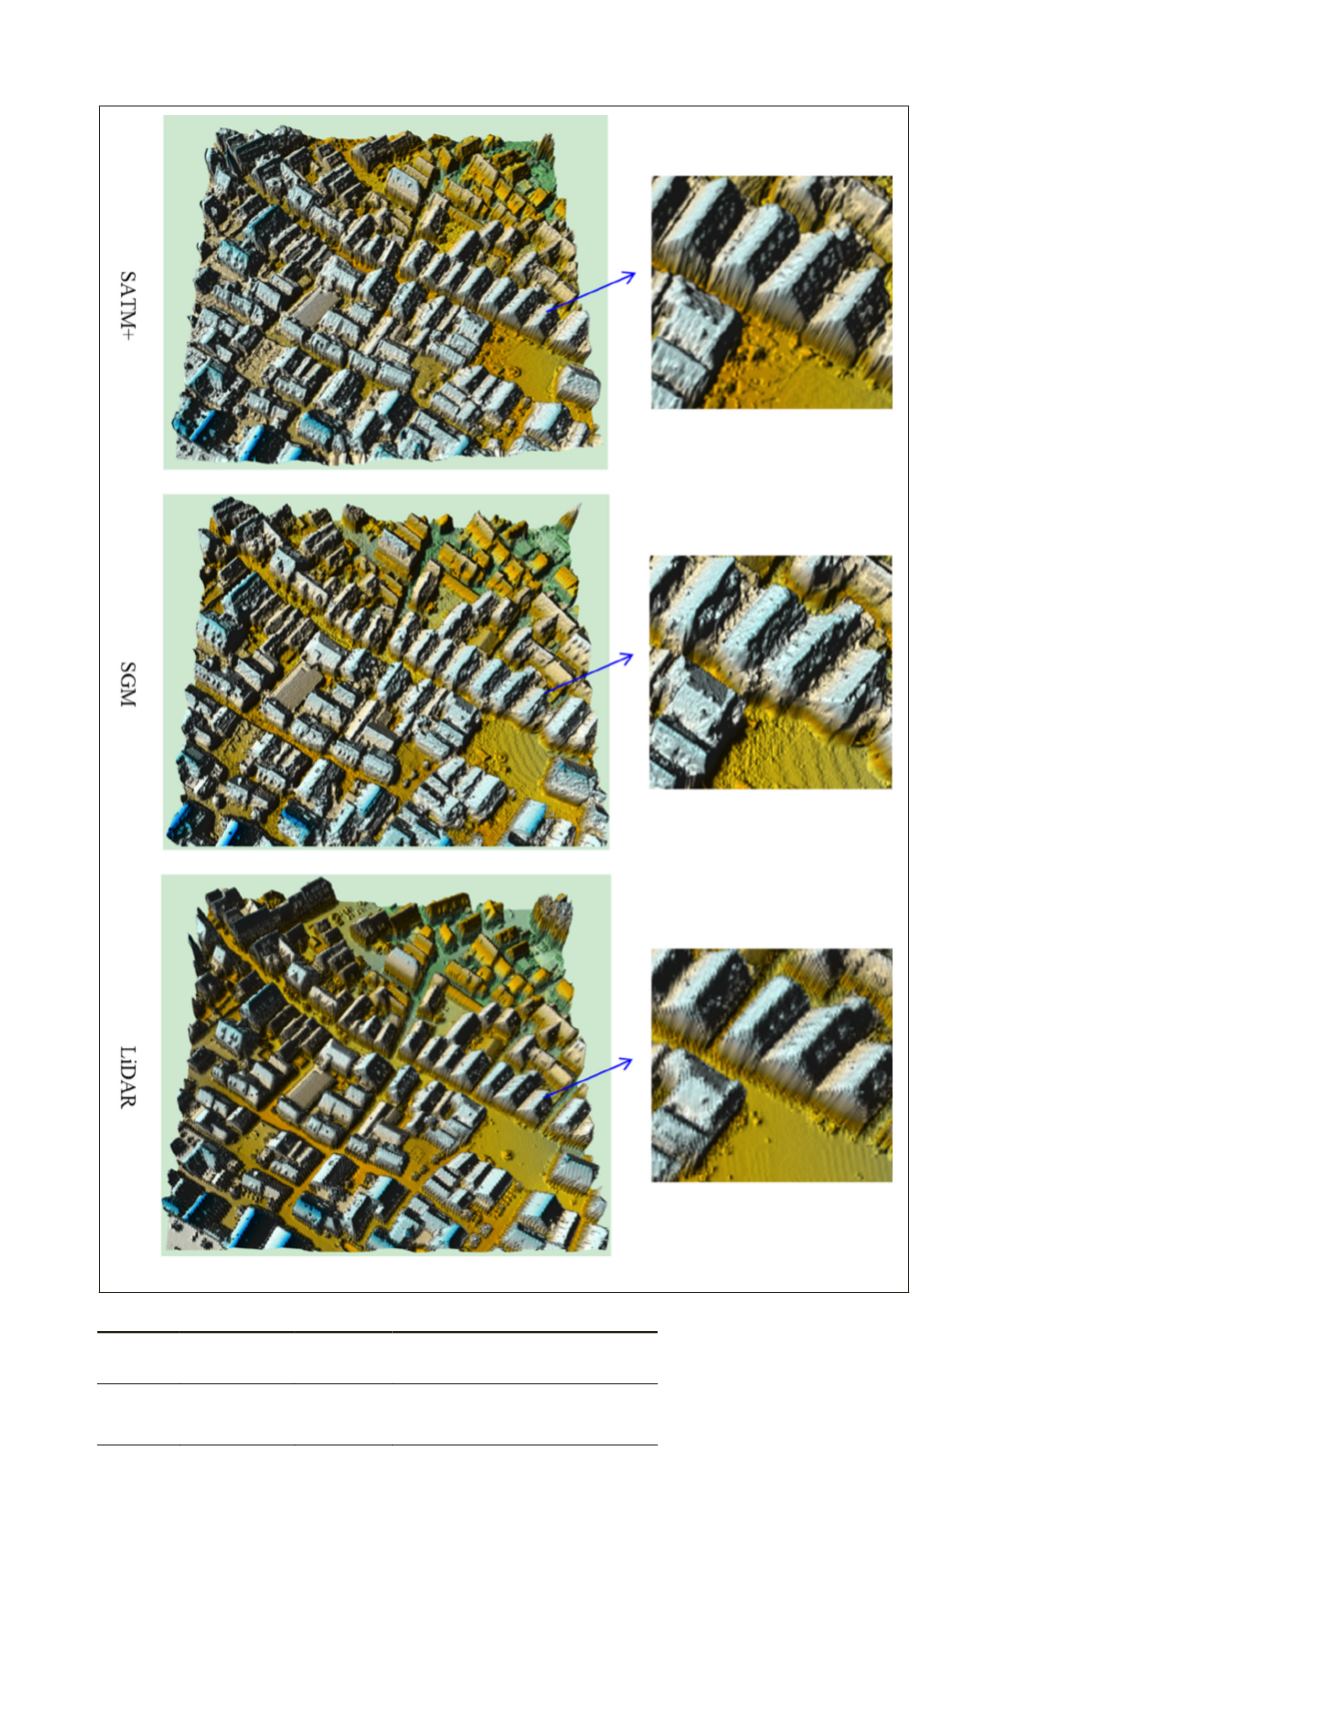
Figure 12 depicts the shaded
DSMs interpolated from 3D point
clouds derived using the proposed
SATM
+,
SGM
, and lidar data. The
SGM
appeared to yield a slightly
smoother
DSM
, compared to that
generated by
SATM
+. However,
the latter offered sharper building
boundaries (e.g., the vertical walls
of buildings in the enlarged views
in Figure 12 compared with the for-
mer. This can be attributed directly
to the integrated image matching
and segmentation strategy, which
yields improved matching perfor-
mances in built-up areas.
The results of the statistical
evaluation are shown in Table 1.
According to the features in this
Table, the
RMSE
and
STD
values for
SGM
were slightly higher than those
for the
SATM
+. However, the two
image matching methods yielded
similar point densities. Notably,
both methods provided greater den-
sities than the lidar point clouds.
Experiment Based on Pleiades-1 Satellite
Images of Hong Kong
Hong Kong is renowned for its im-
pressive skyline, which comprises
a very high density of skyscrapers.
In this study, we used Pleiades-1
satellite images to evaluate the
performance of matching methods
in metropolitan areas, such as the
Central District of Hong Kong. A
pair of Pleiades-1 stereo images
was acquired on 04 March 2013.
These images have a ground resolu-
tion of 0.5 m/pixel, and the pair
has a convergence angle of 14.8°. A
typical densely built-up area was
selected for study (the rectangle
marked in Figure 13).
The airborne lidar data used for
reference was collected between
01 December 2010 and 08 Janu-
ary 2011, and covered the Central
District of Hong Kong. The vertical
accuracy of the lidar data is about
10 cm and the horizontal accuracy is about 1 m according to
the metafile. The point density is about 4 pts/m
2
.
Figure 14 shows shaded DSMs of the study area that were
generated using different approaches. In the flat region in
the northern part of the study area, the
DSM
yielded by
SGM
was smoother than that yielded by
SATM
+. By contrast, in the
south and east parts comprised densely packed buildings
with severe occlusions, only the
SATM
+ recovered most of the
tall buildings. We attribute this outcome to differences in the
methods; in
SATM
+ the matching propagation begins with fea-
ture extraction, whereas
SGM
uses global optimization, which
has been found to contribute to over-smoothing.
Figure 12. Shaded
DSMs
of Vaihingen, generated using different approaches.
Table 1. Statistical analysis of the Vaihingen Experiment.
RMSE (m)
STD (m)
Density (pts/m
2
)
(4–7 pts/m
2
for LiDAR data)
SGM 2.104
2.102
101
SATM+ 1.572
1.567
106
PHOTOGRAMMETRIC ENGINEERING & REMOTE SENSING
March 2018
145


