grey pixels, whereas the white pixels may cause a decrease
in the correlation or even a mismatch. In principle, the white
area should be invalidated when calculating the correlation. In
practice, however, a buffer zone along the edge in the match-
ing window should be considered because of the limitations
in image resolution and edge detection accuracy, and pixels
within the buffer zone should also be involved in the correla-
tion calculation. In accordance with the above observations,
the segment-adaptive similarity measurement uses a sigmoid
function to assign weights to each pixel in the matching
window when calculating the correlation coefficient. These
weights depend on the distance from the pixel to the edge.
The sigmoid function is applied to weight the pixels in the
matching window as follows:
S
t
e
t
( )
=
+
−
1
1
α
(2)
where
t
represents the signed distance from the pixel to
the edge. If the pixel is on the same side as the point to be
matched,
t
is positive; otherwise, it is negative.
α
is the coef-
ficient used to determine the size of the buffer zone, based
on the image resolution and the edge detection accuracy.
Figure 6b shows an example of the weight distribution for
pixels within the matching window shown in Figure 6a. The
black line in the middle of Figure 6b corresponds to the edge
between the white and grey regions in Figure 6a.
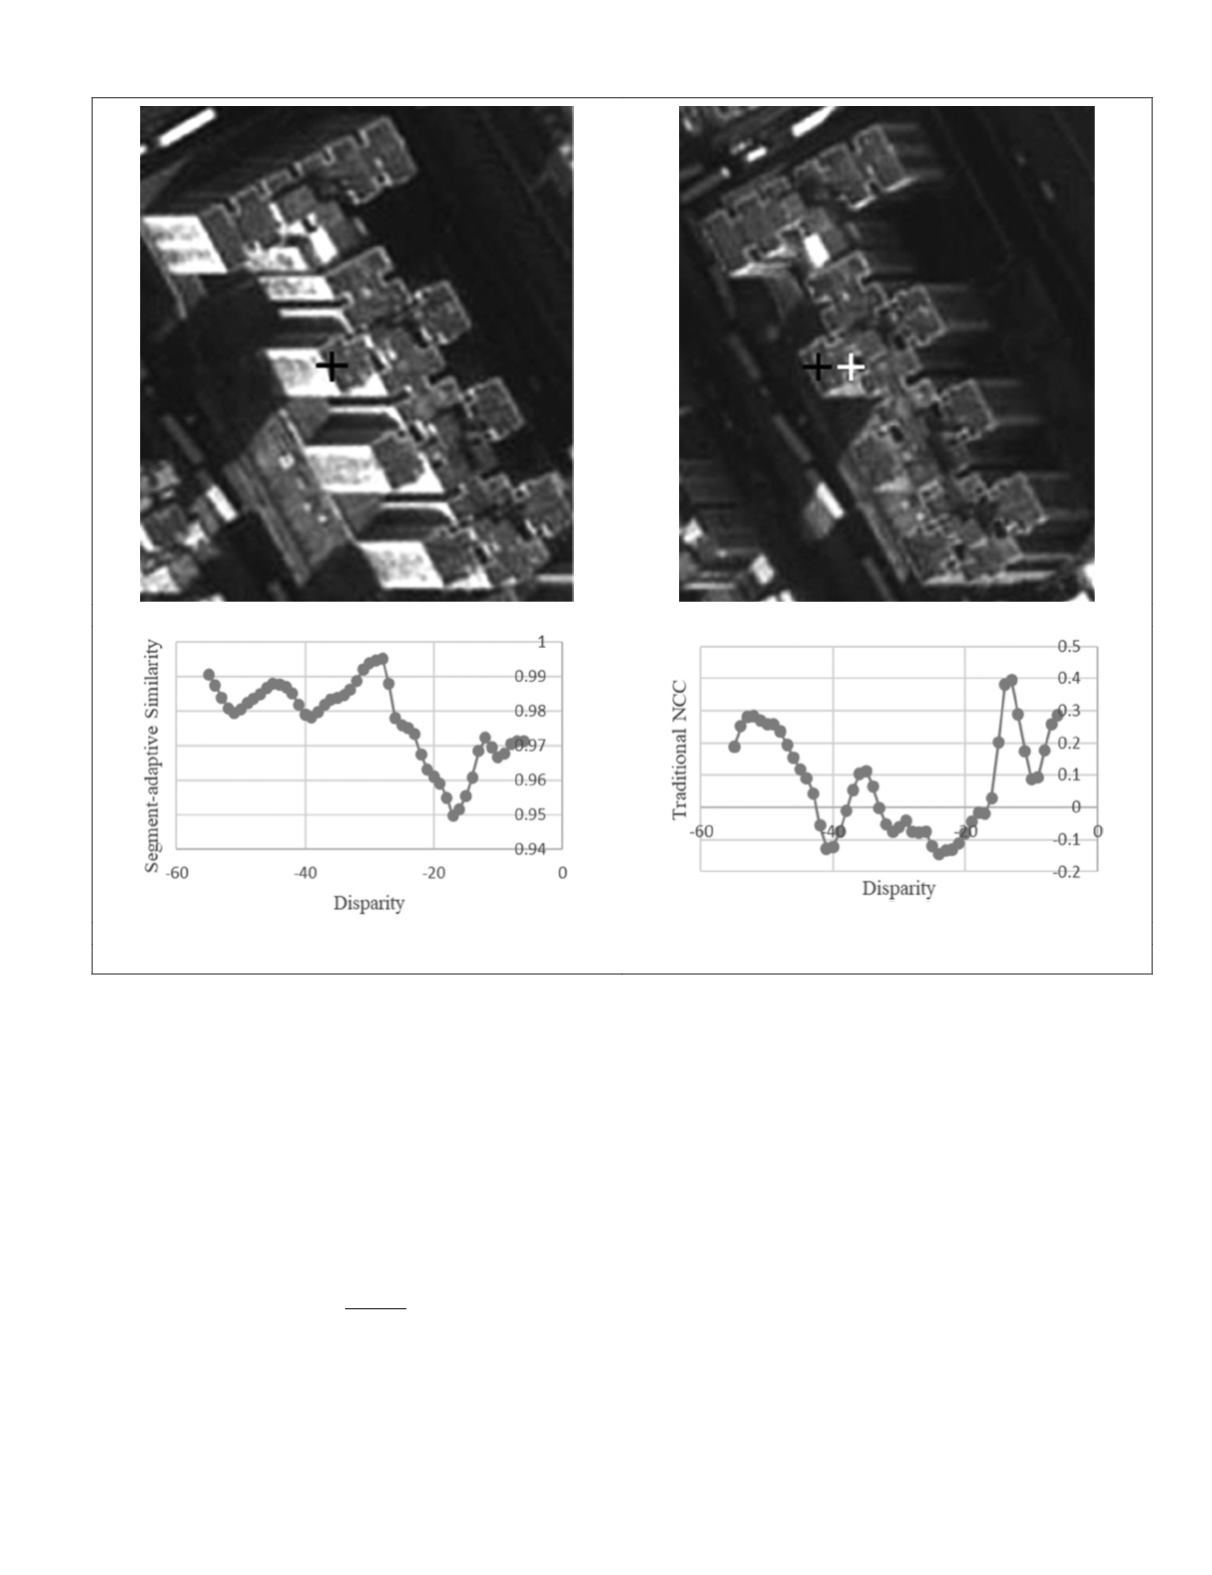
Figure 7a and 7b present a subset of paired high-resolution
satellite images taken near a building. The black cross in the
left image is the point to be matched in the right image. The
segment-adaptive similarity correlation values within the
search range (disparity: ±25 pixels near the predicted dispar-
ity) are shown in Figure 7c, and the traditional normalized
correlation coefficient (
NCC
) values are shown in Figure 7d. Ac-
cording to the matching strategy, the pixels with the maximum
correlation coefficient values are candidate matches, and are
labeled with black (segment-adaptive similarity correlation)
and white crosses (traditional
NCC
) in the right image. As de-
picted in Figure 7a and 7b, the black cross is the correct match.
Figure 7c and 7d depict many negative correlation coef-
ficients in the traditional
NCC
, whereas all correlation coeffi-
cients for the segment-adaptive similarity are positive. We at-
tribute this to the fact that in the left image, the facade near the
feature point is brighter than the roof, whereas the facade is
occluded in the right image. The traditional
NCC
still includes
the pixels from the facade in the matching window, whereas
the corresponding pixels in the right image are located on the
ground and are darker than the roof pixels, leading to negative
(a)
(b)
(c)
(d)
Figure 7. Example of the segment-adaptive similarity correlation.
PHOTOGRAMMETRIC ENGINEERING & REMOTE SENSING
March 2018
141


