classifications. We used a fuzzy reference labeling procedure
based on the linguistic scale proposed by Gopal and Wood-
cock (1994) in order to account for mixed pixels and ambigu-
ity among classes (Table S2). Specifically, for each sample
point in each nominal year, we visually assigned the seven
potential land cover classes a score ranging from 1 (absolutely
and unequivocally incorrect) to 5 (absolutely and unequivo-
cally correct), with a score of 3 or more indicating that a
given class would be an acceptable map label (Table S2).
We always labeled one class as the best possible choice for a
given sample unit. It was impossible to assign reference labels
for some sample units, particularly in 1996 when coverage of
fine resolution imagery was more sparse, in which case those
sample units were discarded from further analysis. For com-
parison, we also used the same reference dataset to assess the
accuracy of the 2001 and 2006
NLCD
maps, though we exclud-
ed any sample points that were classified as Developed, Open
Space in
NLCD
, resulting in lower sample sizes and larger
standard errors for the
NLCD
assessments. Following best
practice recommendations (Olofsson
et al
., 2014), we provide
estimates and 95% confidence intervals of overall accuracy
(
OA
), producer’s accuracy (PA), and user’s accuracy (UA), all
of which were derived from area-weighted confusion matrices
based on both the best possible class label (i.e., the class with
the maximum score in the linguistic scale) and on any accept-
able class label (Table S2) (Gopal and Woodcock, 1994).
Results
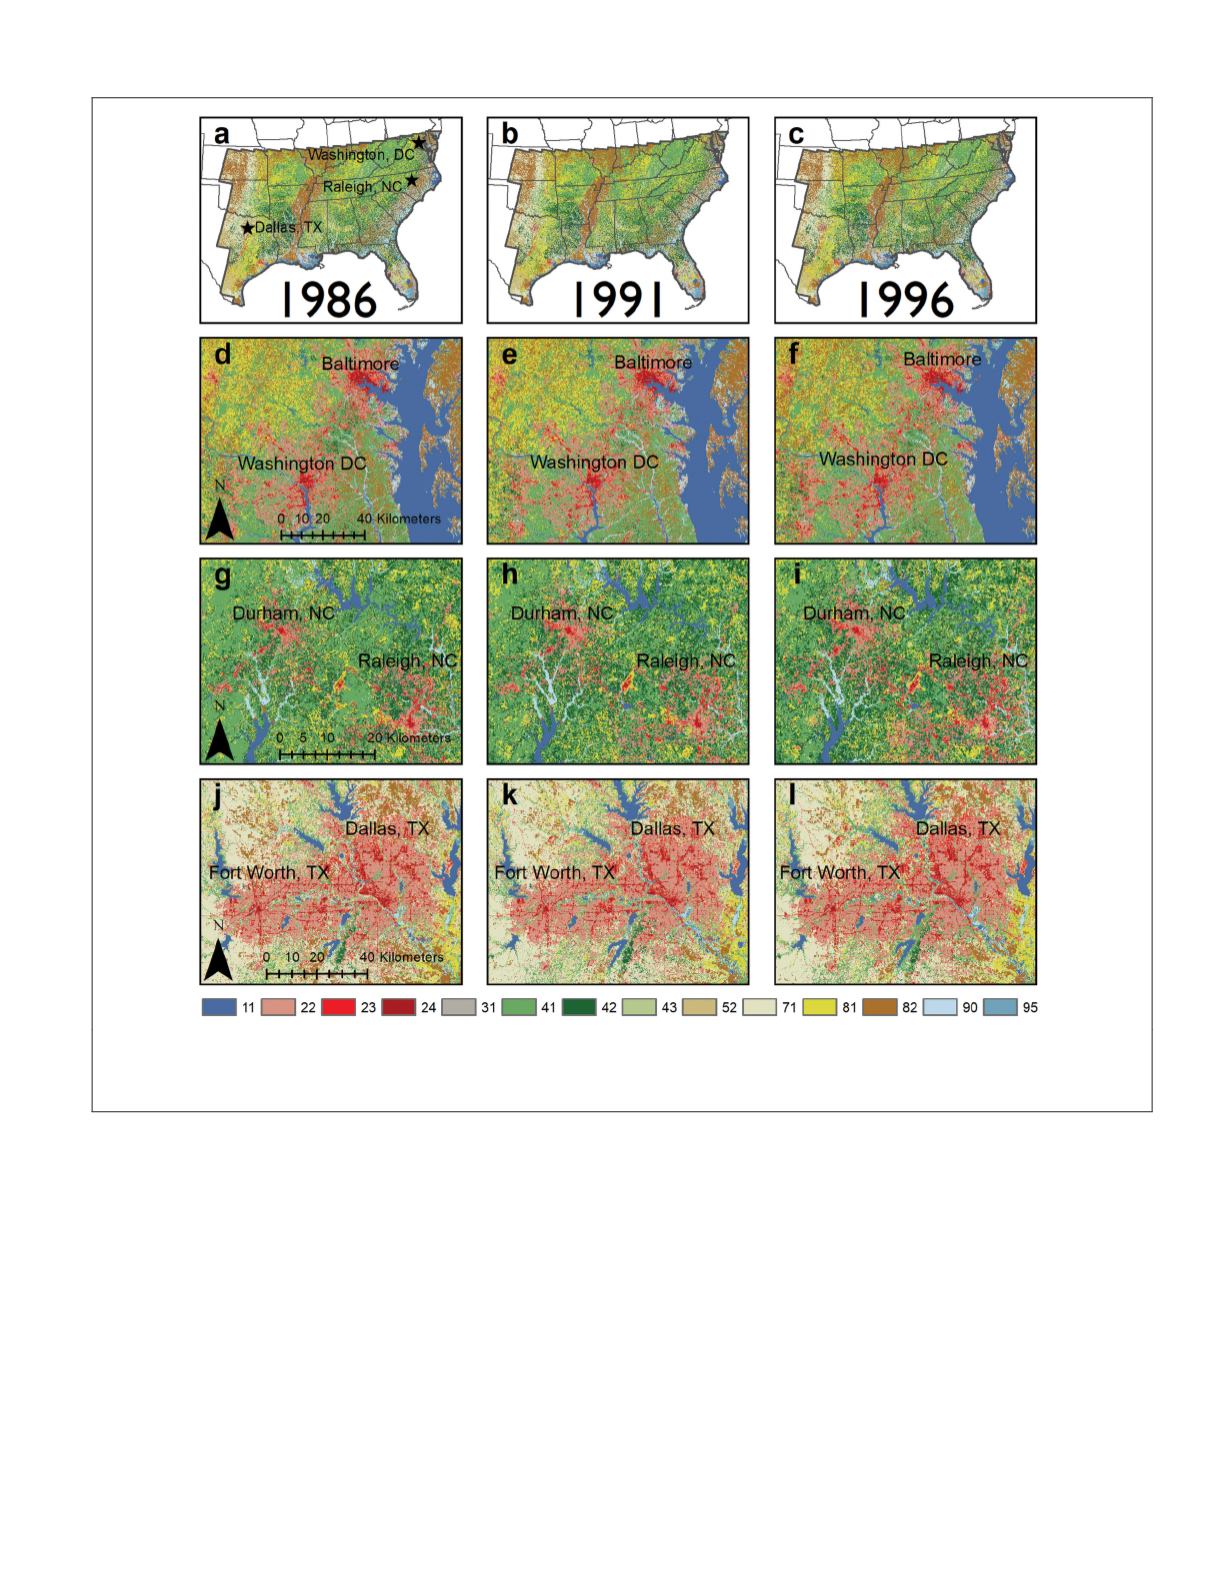
Our Southeast classification products for 1986, 1991, and
1996 are shown in Figure 3, including enlargements of three
representative urban regions (the Washington D.C. and Bal-
timore metropolitan areas, the Raleigh-Durham-Chapel Hill
“Research Triangle” of North Carolina, and the Dallas-Fort
Figure 3. Updated
AASG
Classifications for 1986, 1991, and 1996. (a-c) Full study area, and zoomed in views of (d-f)
Washington D.C. and Baltimore, MD, (g-i) the Research Triangle, NC (Raleigh-Durham-Chapel Hill), and (j-l) Dallas-Fort
Worth, TX. The classes and color scale are the same as the
NLCD
modified Anderson Level II classification shown in Figure 1,
but with no Developed, Open Space class.
PHOTOGRAMMETRIC ENGINEERING & REMOTE SENSING
September 2018
563


