artificial intelligence, can
provide the optimal solution
of the optimization problem.
It has gradually become an
emerging search algorithm
with strong global search abili-
ty, fast convergence speed, and
can effectively solve the local
convergence problems. The
swarm intelligence algorithm,
originated from the research of
artificial life, mainly includes
Ant Colony Optimization,
Particle Swarm Optimization
(
PSO
), and Artificial Fish-
swarm Algorithm.
PSO
, proposed by American
scientists Kennedy and Eber-
hart (Eberhart and Kennedy
1995; Kennedy 1997, 2011)
is a stochastic optimization
method that simulates the self-
organizing behavior of birds
and other biological swarms.
Although this algorithm has no
adaptive learning ability, it is
simple in operation and good
in adaptability. The global op-
timal solution can be obtained by adjusting fewer parameters.
Nevertheless, the neural network algorithm is a nonlinear
information processing system. It has strong adaptive learning
ability and can effectively simulate nonlinear relationships.
But the algorithm has a slow convergence rate and the pa-
rameters are limited by experience and continuous trainings.
The noise and other information can be merged to create an
over-fitting phenomenon and make the method fall into local
optimum. Therefore, combining the neural network algorithm
with
PSO
can effectively exploit the advantages of adaptive
learning and global optimization capabilities. It can also avoid
the neural network getting into local minimum and improve
the global search ability of the network. Yang
et al.
(2016)
combined the
PSO
algorithm and the lan
model Simultaneous Heat and Water to
vegetation parameters that are related to
Results revealed that parameters optimi
improved simulations of soil moisture. Jin
et al.
(2017) used
the
PSO
algorithm to estimate winter wheat yield based
HJ-1A/B
and
RADARSAT-2
imaging data. The results indicated the pre-
dicted and measured yield had agreement when the estimated
biomass was used as the dynamic input variable (
R
2
= 0.42
and Root Mean Square Error (
RMSE
) = 0.81 ton/ha).
The present paper proposes a combining optimization
algorithm based on
PSO
and neural network to establish an
implicit relationship between backscatter coefficient and soil
moisture. The
PSO
is used to optimize the weights of the neu-
ral network and the optimal weight of the neural network is
obtained through continuous iterative. Optical and radar data
are combined as the input variables of the optimization model
to eliminate the influences of surface roughness and vegeta-
tion on radar signal in the vegetation-covered soil moisture
estimation.
Materials and Methods
Study Area and
In Situ
Measurements
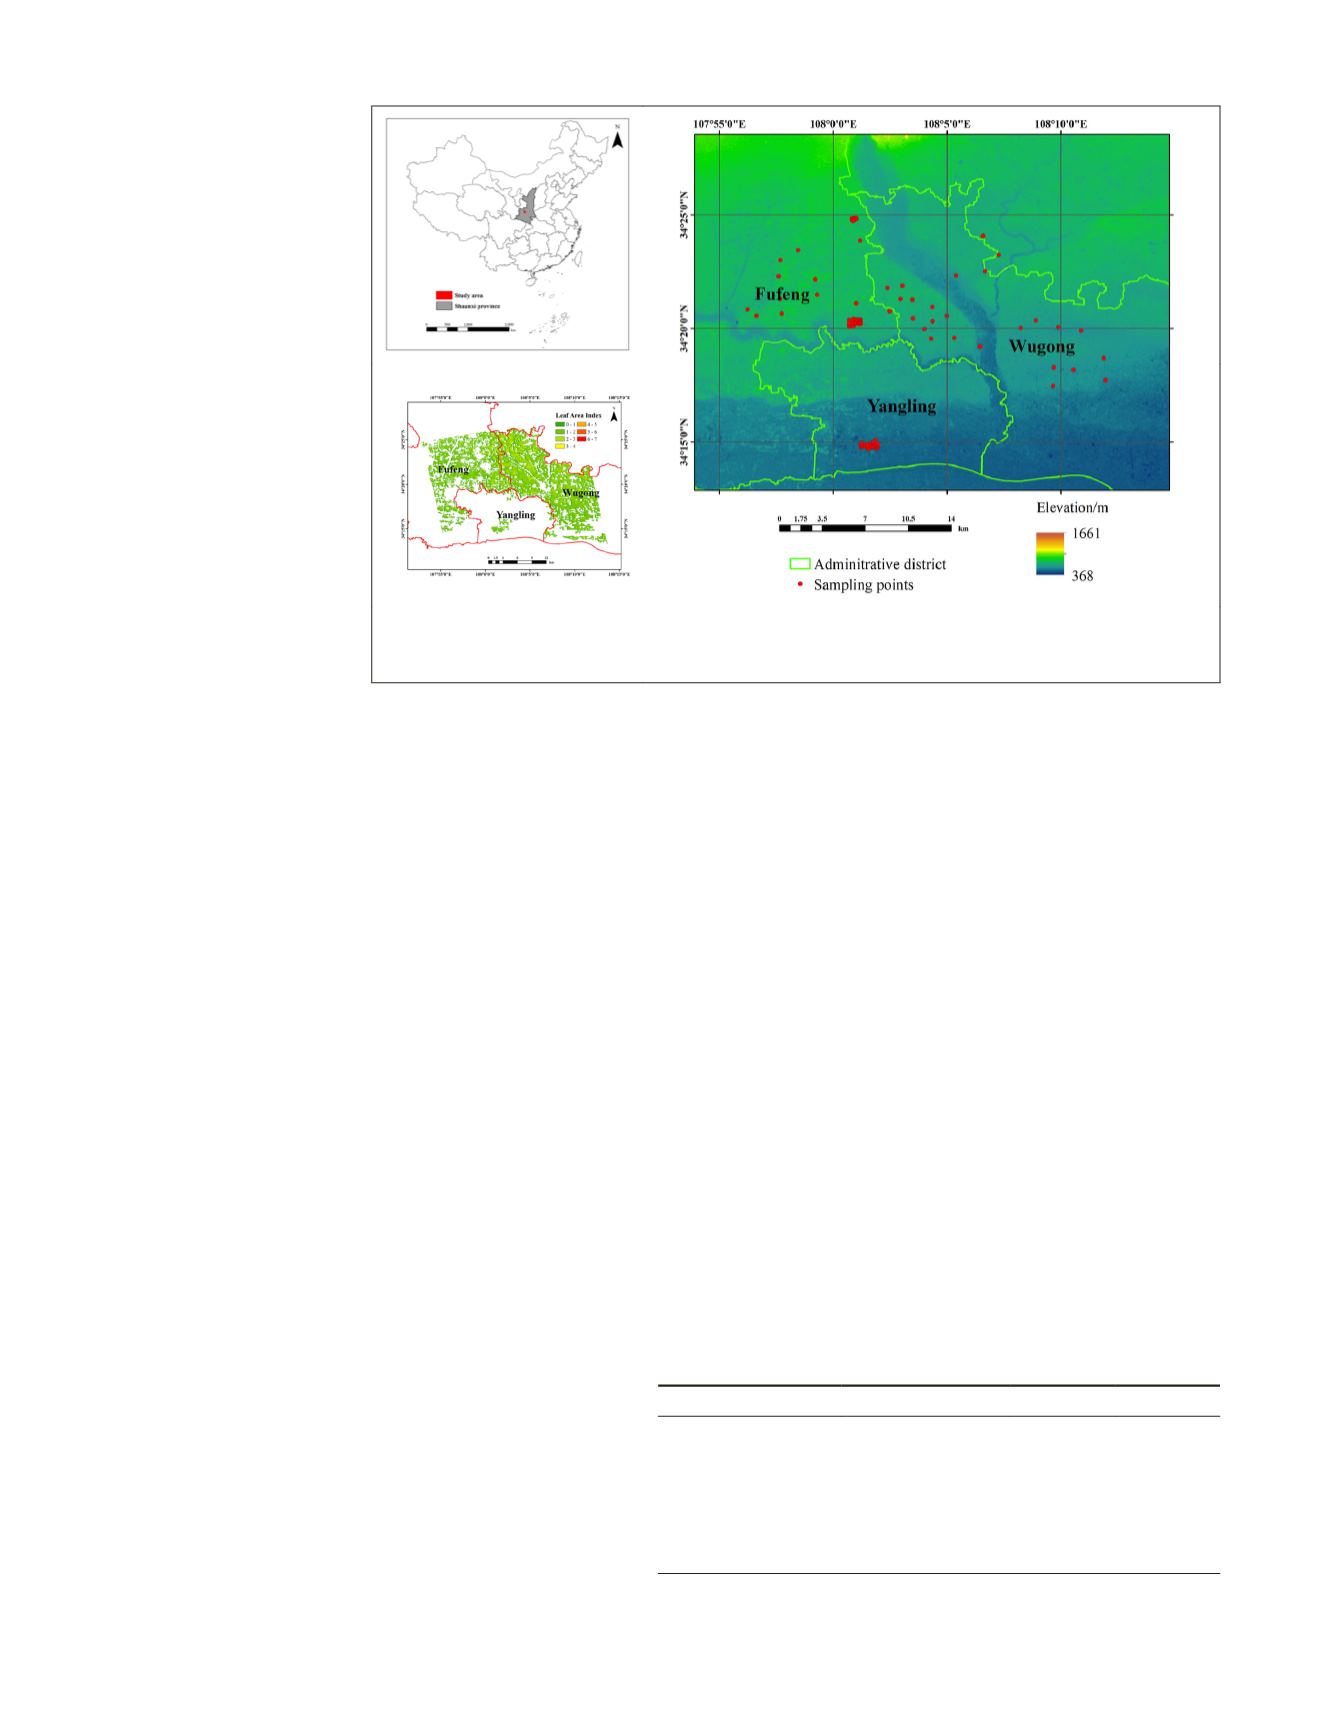
The study area is located in Yangling District, Shaanxi
Province, China (Figure 1). It is a homogeneous agricultural
area for China’s agricultural high-tech industry. Wheat is the
main applied cultivation of this site, which is a wheat-maize
rotational cultivated field. The altitude of the region is from
431 m to 559 m and the climate type is a typical semihumid
continental monsoon climate with four distinct seasons. The
average temperature is 12.9° C, the annual average precipita-
tion is 635.1 mm. The detail of the study area can be found
from the website of Management Committee of Yangling
Agricultural High-Tech Industrial Demonstration Zone (www.
yangling.gov.cn).
The field experiment is carried out during the late jointing
stage of winter wheat. Typical samples are collected during
the experiment and the measurements include the canopy
spectrum of winter wheat, soil moisture content and sur-
face roughness (Table 1). The canopy spectrum of wheat is
l Spectral Devices spectrometer and the
is measured by Time Domain Reflec-
epth of 7.6 cm in representative areas.
ive measurements collected around the
sampling point is used. Then, all of the samples are randomly
divided into two parts: two-thirds of sampling points are
mainly used for training the inversion model and the re-
maining data is used for accuracy evaluation. The roughness
parameter is obtained by photographing the roughness plate
placed on the ground surface and binarizing the photograph
to obtain the contour curve of the rough surface. The two
roughness parameters including the root mean square (RMS)
height and the correlation length are calculated according to
the relative length of the roughness plate and the height rela-
tionship between the points.
Table 1. Details of field measurements.
Parameters
Tools
Units
Values
Soil moisture content TDR
cm
3
/cm
3
0.08–0.48
RMS height
Roughness plate cm
0.5–3.1
Correlation length Roughness plate cm
10.6–24.6
Plant density
Rule
— 187
Canopy temperature Point thermometer °C
15
Plant height
Rule
cm
40–130
Figure 1. Location of the study area in Yangling District of Shaanxi province. The left image
indicates the distribution map of leaf area index (
LAI
) and the right image represents digital
elevation model (
DEM
).
790
November 2019
PHOTOGRAMMETRIC ENGINEERING & REMOTE SENSING


