Discussions
Effect of Initial Number of Particle
The number of the particles has a certain influence on the
running result and time of the
PSO
. Trelea (2003) found that
the initial number of the particles should be selected in the
range of 20–100. If the number of particles is too small, the
running cost can be reduced but the global search ability and
convergence speed of the algorithm will decrease. Moreover,
selecting too large number of particles will increase the run-
ning cost. Therefore, selecting the appropriate number of
particles will promote the efficiency of the algorithm. In this
study, the number of particles is set to 10, 20, 40, 60, 80, and
100, respectively. Then, learning factors
c
1
and
c
2
are both
determined to 2. The inertia weight is 0.8 and the maximum
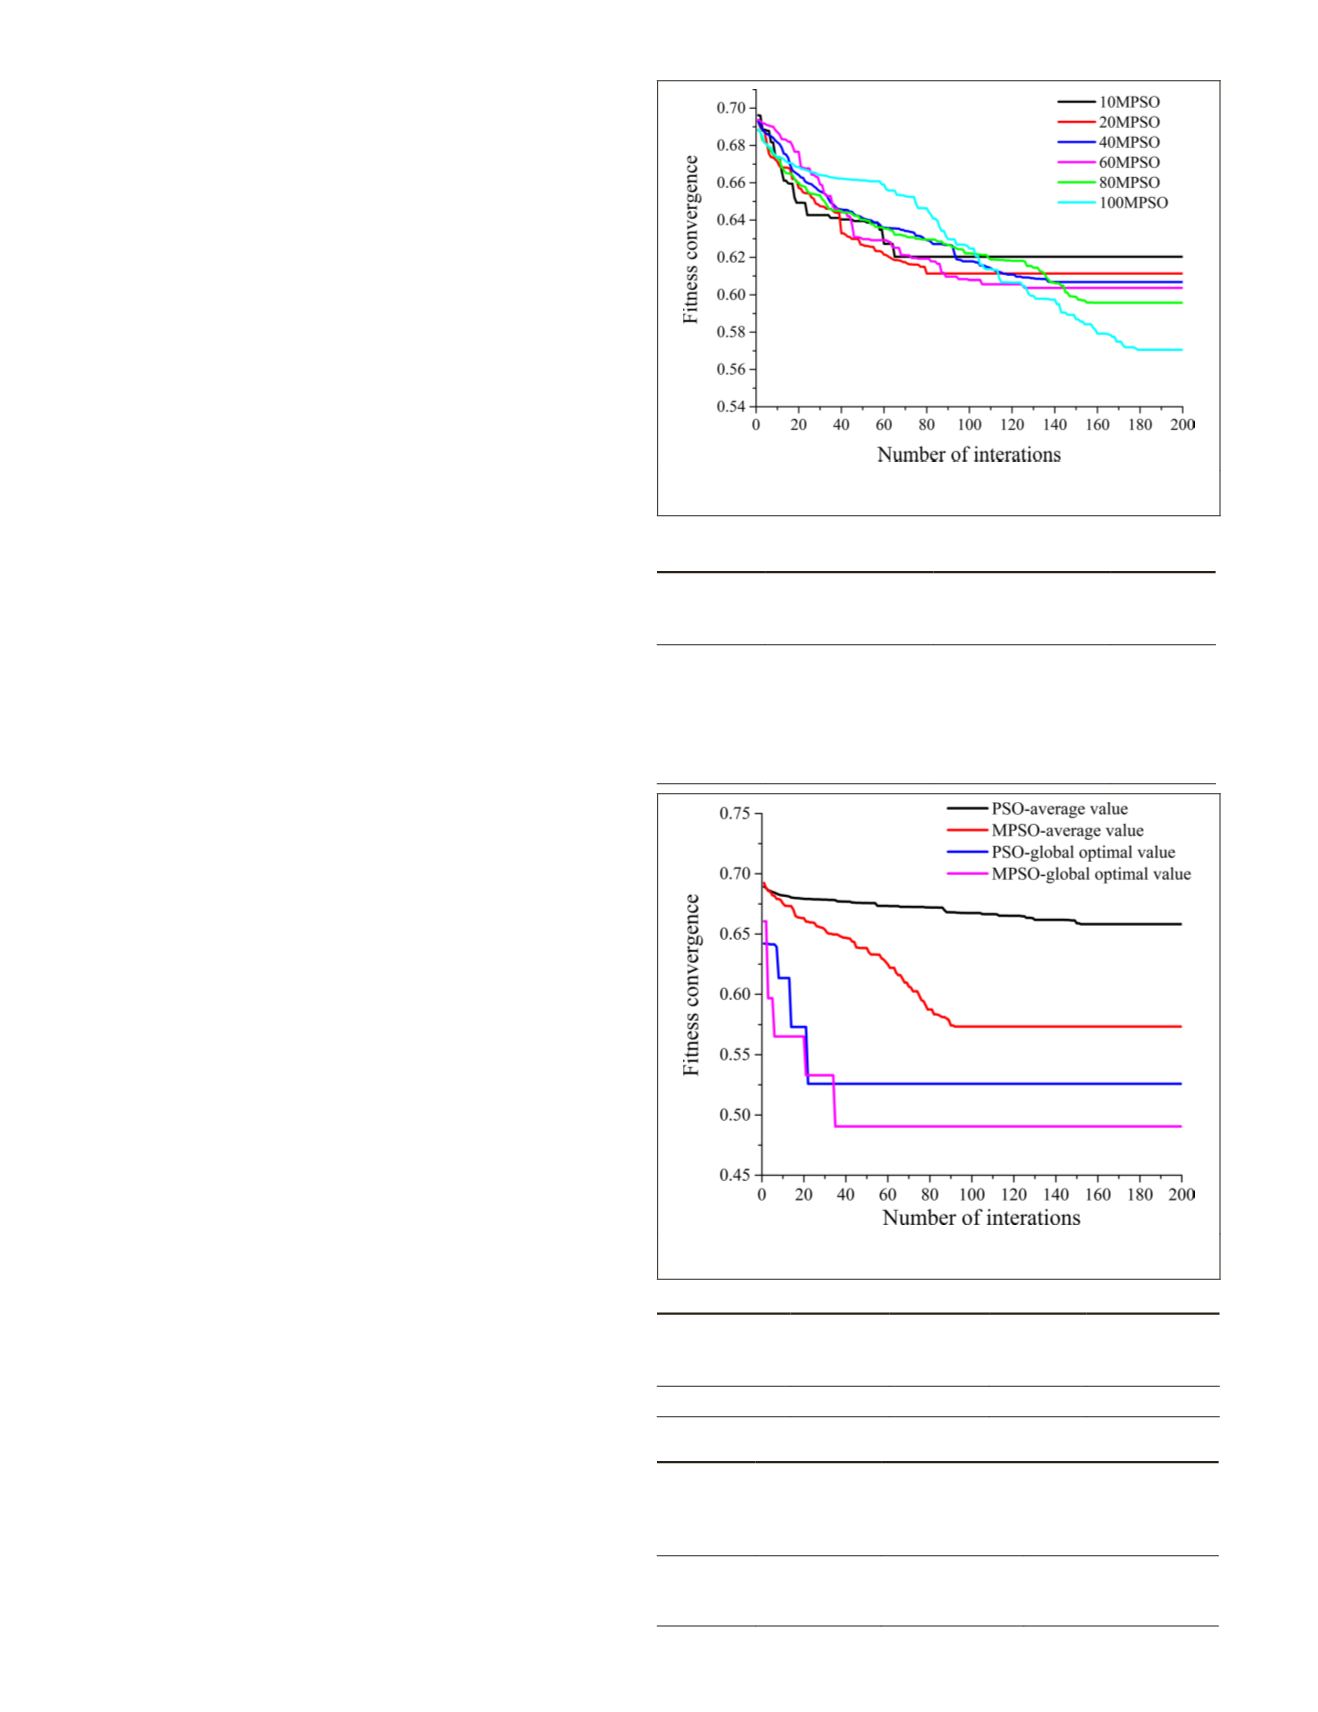
number of iterations is 200. The fitness curve of the
MPSO
algorithm with different numbers of particles is shown in
Figure 7 and the analysis result is listed in Table 3.
As is revealed in Figure 7, for different numbers of par-
ticles, the convergence tendency of the fitness is relatively
consistent and the convergence can be achieved quickly. The
value of fitness is concentrated between 0.56 and 0.70. For
different numbers of particles, the number of iteration when
converging and the values of fitness are slightly different.
As is shown in Table 3, when the number of particles is 10,
the convergence speed of the algorithm is the fastest and the
number of iterations when converging is 65. But the fitness
value is the highest and the convergence is the worst. With
the number of particles increasing, the fitness value is getting
better. When the number of particles is 100, the fitness value
is the best when converging. But its running time is several
times more than that of other ways. When the number of
particles is 60, the fitness value when converging is close to
that when the number of particles is 100 and the running time
is relatively shorter. The convergence is faster than that when
the number of particles is 40. Therefore, when the selected
number of particles is 60, the algorithm can get better search
ability and maintain good operating efficiency.
Algorithm Convergence Analysis
In order to verify the global search ability and convergence
speed of the optimization algorithm, this study calculates the
difference between the average value of f
optimal value of the fitness for each itera
can effectively reflect the global search a
level of the algorithm. Table 4 shows the
of the algorithm. As is described above, the algorithm gets a
good global search ability when the initial number of particles
is about 60. Thus, the initial number of particles is set to 60.
In order to verify the convergence of the
MPSO
algorithm, the
original
PSO
algorithm is chosen as a comparison to explore
the iterative process. Figure 8 is a fitness convergence graph
of the two algorithms and Table 5 shows the analysis results
of fitness convergence. From the convergence results of the
algorithms listed in Figure 8 and Table 5, the
MPSO
achieves
convergence when iterating to 92 times and convergence rate
is faster compared with the original
PSO
algorithm. The differ-
ence between the fitness average value and the fitness global
optimal value is smaller and the local convergence is avoided.
Therefore, the
MPSO
has better convergence and the search
ability is stronger than that of the original
PSO
algorithm.
Conclusions
This paper proposes a method based on modified particle
swarm optimization and back propagation neural network
(
MPSO
-
BP
) algorithms for collaborative inversion of surface
soil moisture using active and passive remote sensing data.
This method introduces the
MPSO
algorithm to optimize the
Figure 7. Fitness convergence curve of
MPSO
based on
different numbers of particles.
Table 3. Table of sensitivity analysis about different numbers
of particles.
Number of
Particles
Number of
Iterations when
Converging
Average Value of
Fitness when
Converging
Operation
Time (s)
10
65
0.620
45
20
80
0.611
80
40
138
0.607
135
60
126
0.604
165
80
159
0.596
255
100
179
0.571
320
Figure 8. Comparison analysis of fitness convergence
between
MPSO
and
PSO
.
Table 4. Values of the initial parameters of
MPSO
.
Initial
Number
of Particles
Learning
Factor
C
1
Learning
Factor
C
2
Inertia
Weight
ω
The Maximum
Number of
Iterations
60
2
2
0.8
200
Table 5. Analysis results of fitness convergence.
Algorithm
Number of
Iterations
when
Converging
Average
Value of
Fitness when
Converging
Difference between
Fitness and Global
Optimal Value when
Converging
BP
>200
—
—
PSO-BP 152
0.658
0.132
MPSO-BP 92
0.573
0.083
796
November 2019
PHOTOGRAMMETRIC ENGINEERING & REMOTE SENSING


