evaluated the synergistic contribution of L-, C-, and X-band
SAR
data to tropical land cover mapping and concluded that
the multi-sensoral integration is beneficial for the land cover
classification.
Although the combination of different
PolSAR
frequency
bands is useful for improving land cover classification ac-
curacies, some of the frequency bands may not be necessary
because of their marginal contribution and substantial cost.
The selection of the optimal combination of
PolSAR
frequency
bands for various land cover classification schemes is still a
challenge because of the limited studies on the assessment
of all the possible combinations of different frequency bands
of
PolSAR
data, especially fully
PolSAR
data, for land cover
classification or on the effect mechanisms of
PolSAR
frequency
variation on land cover classification. To contribute to filling
this gap, this study investigates the optimal combination of
PolSAR
data acquired at X, C, and L frequency bands, which
are used by most orbital
PolSAR
systems, for different schemes
of land cover classification. In this study, the different com-
binations of L-band
ALOS
PALSAR
fully
PolSAR
data, C-band
RADARSAT-2
fully
PolSAR
data, and X-band
TerraSAR-X HH
SAR
data were used separately for land cover classification. A
method that integrates polarimetric decomposition, object-
based image analysis (
OBIA
), decision trees (
DTs
), and support
vector machines (
SVMs
) was employed for the classification.
Polarimetric decomposition theorems were used to interpret
the
PolSAR
scattering mechanisms at the different frequency
bands to investigate the effect mechanisms of radar frequency
variation on the land cover classification. The classification
results of the different combinations of L-, C-, and X-band
data are assessed and discussed, and concluding remarks are
then provided.
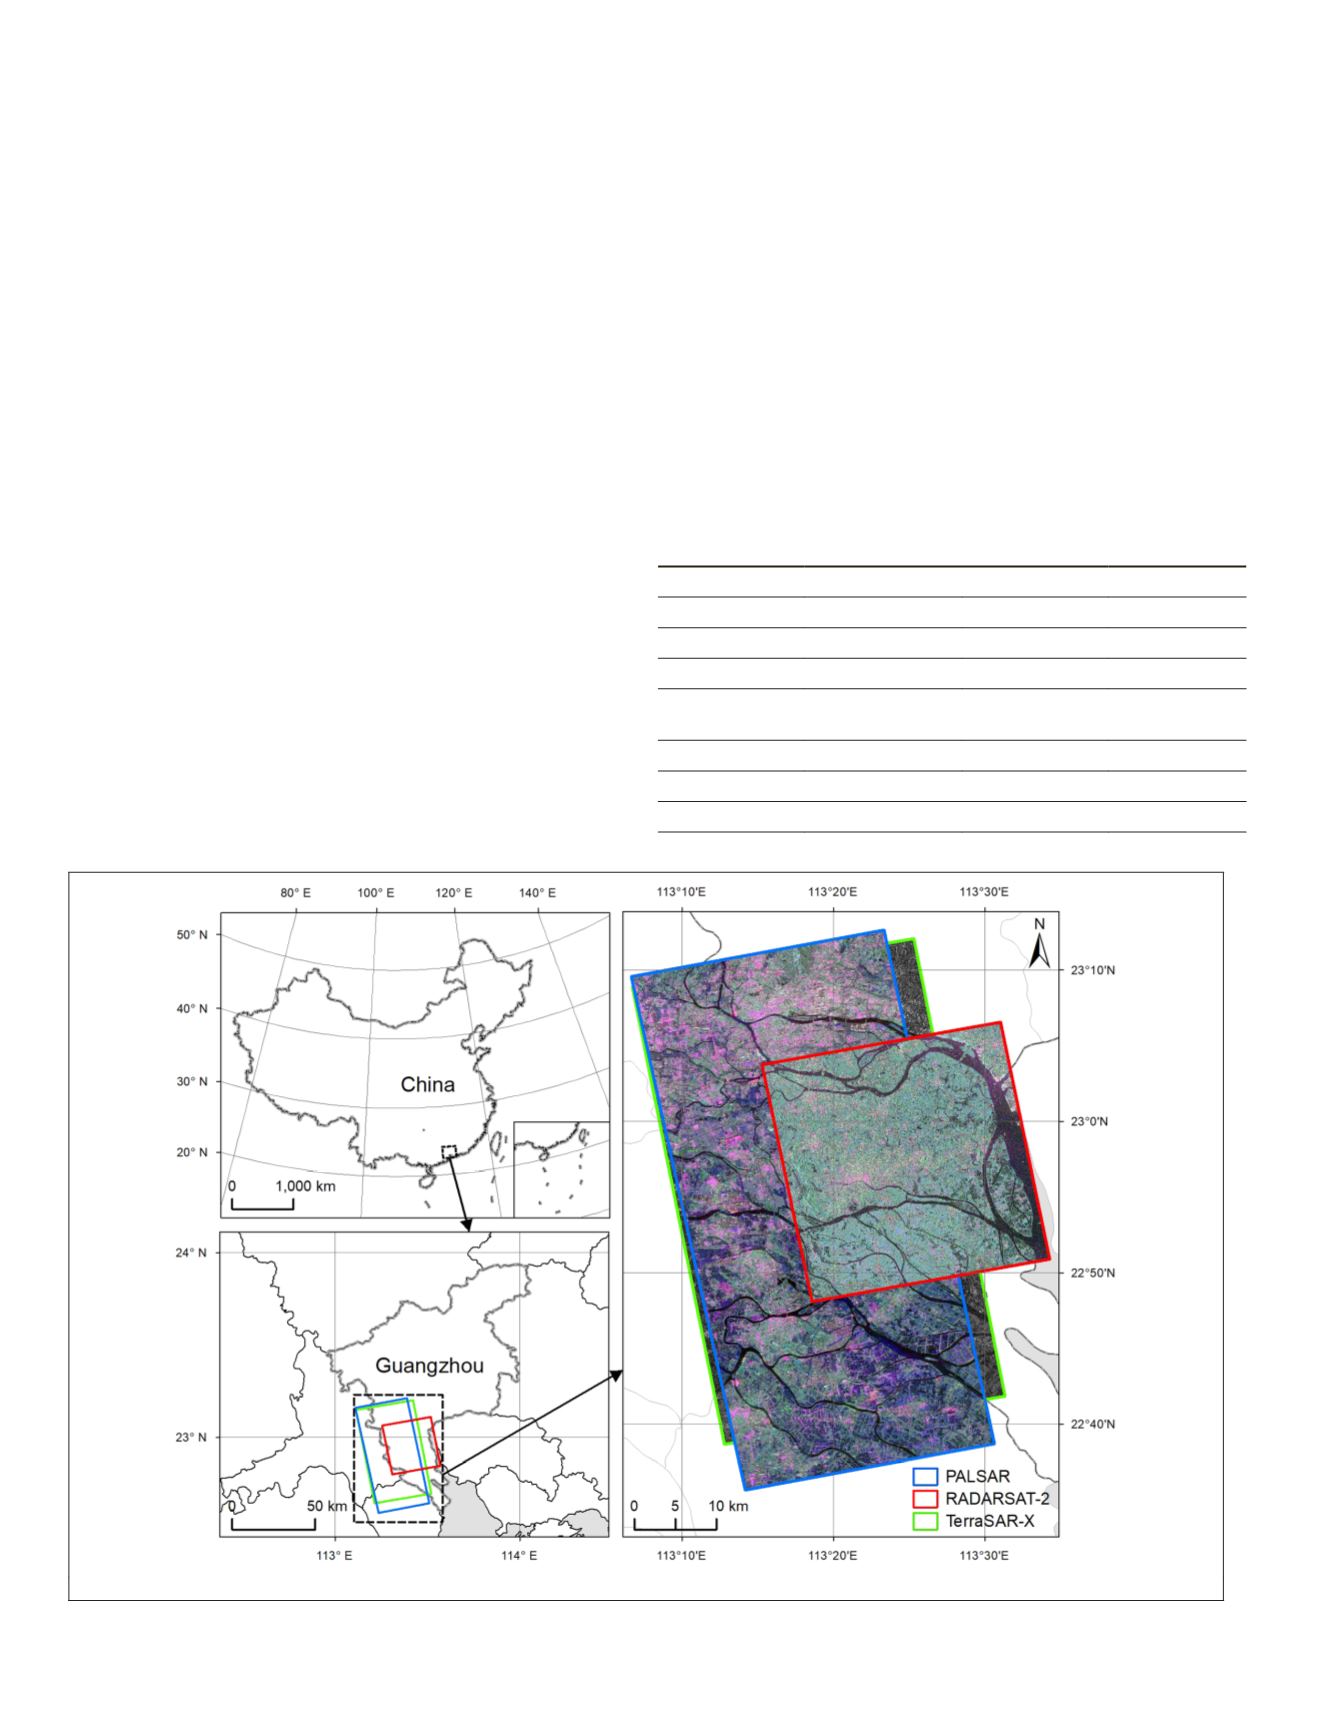
Study Area and Data
The study area was situated in Guangzhou City in southern
China (Figure 1). An L-band
ALOS
PALSAR
image, a C-band
RADARSAT-2
image, and an X-band
TerraSAR-X
image were col-
lected for this study (Figure 1). The
PALSAR
and
RADARSAT-2
images are fully polarimetric, and the
TerraSAR-X
image is
single polarized. Table 1 lists the detailed imaging parameters
of these three images. The Level-1 land cover classes for
SAR
image classification are typically built-up areas, water, bare
land, tall vegetation (trees), and short vegetation (usually less
than 3 m high) (Kouskoulas
et al.
2004). In accordance with
this classification scheme, the land cover in the study area
was classified into six categories: water, bare/sparsely vege-
tated land, forests, crop/rangeland, banana trees, and built-up
areas (Figure 2). Rangeland includes grasses, grass-like plants,
forbs, and shrubs. Banana trees were separated from forests
and crop/rangeland because of their distinctive backscattering
signature in the
SAR
images.
Table 1. Imaging parameters of the
ALOS
PALSAR
,
RADARSAT-2
,
and
TerraSAR-X
data.
PALSAR
RADARSAT-2
TerraSAR-X
Acquisition date 27 March 2010 26 April 2010 17 April 2010
Frequency band L
C
X
Polarization
HH
+HV+VH+VV
HH
+HV+VH+VV
HH
Pixel spacing
(range × azimuth)
23.11 m × 3.55 m 4.97 m × 7.66 m 2.06 m × 2.06 m
Number of looks 7
1
1
Incidence angle 23.91
37.56
29.48
Pass
Ascending
Ascending
Ascending
Figure 1. Study area and data (ALOS PALSAR and RADARSAT-2 images are the Pauli RGB composition).
800
November 2019
PHOTOGRAMMETRIC ENGINEERING & REMOTE SENSING


