Figure 1. Total Vulcan CO
2
emissions excluding CO
2
emissions of power production.
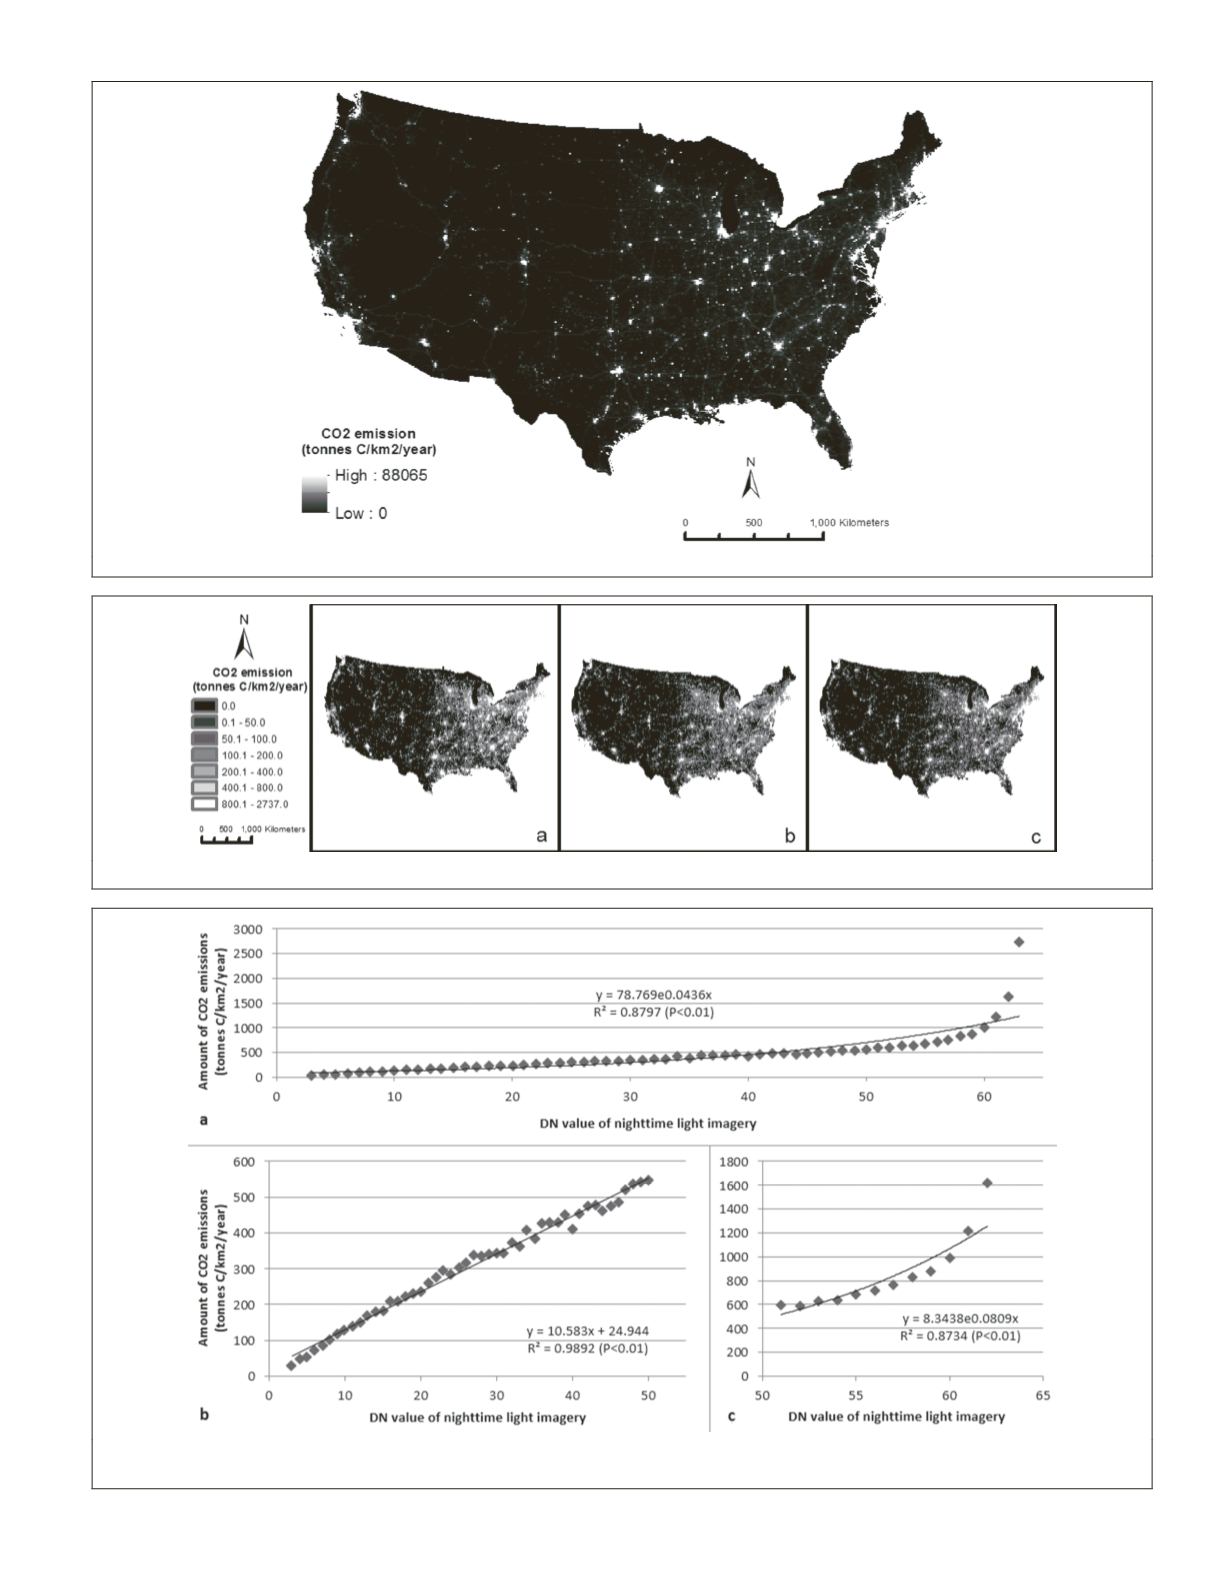
Figure 2. CO
2
emissions map produced by (a) linear, (b) exponential, and (c) and piecewise functions.
Figure 3. Correlations between DN values of nighttime light imagery and amount of CO
2
emissions for the contiguous US. The DN value of
63 was excluded from the regression in Figure 3c due to its incompatibility with the other DN values in stable lights image products.
PHOTOGRAMMETRIC ENGINEERING & REMOTE SENSING
December 2015
937


