the
LIDAR
-
DEM
from the elevation of the tie point at the same
planar position.
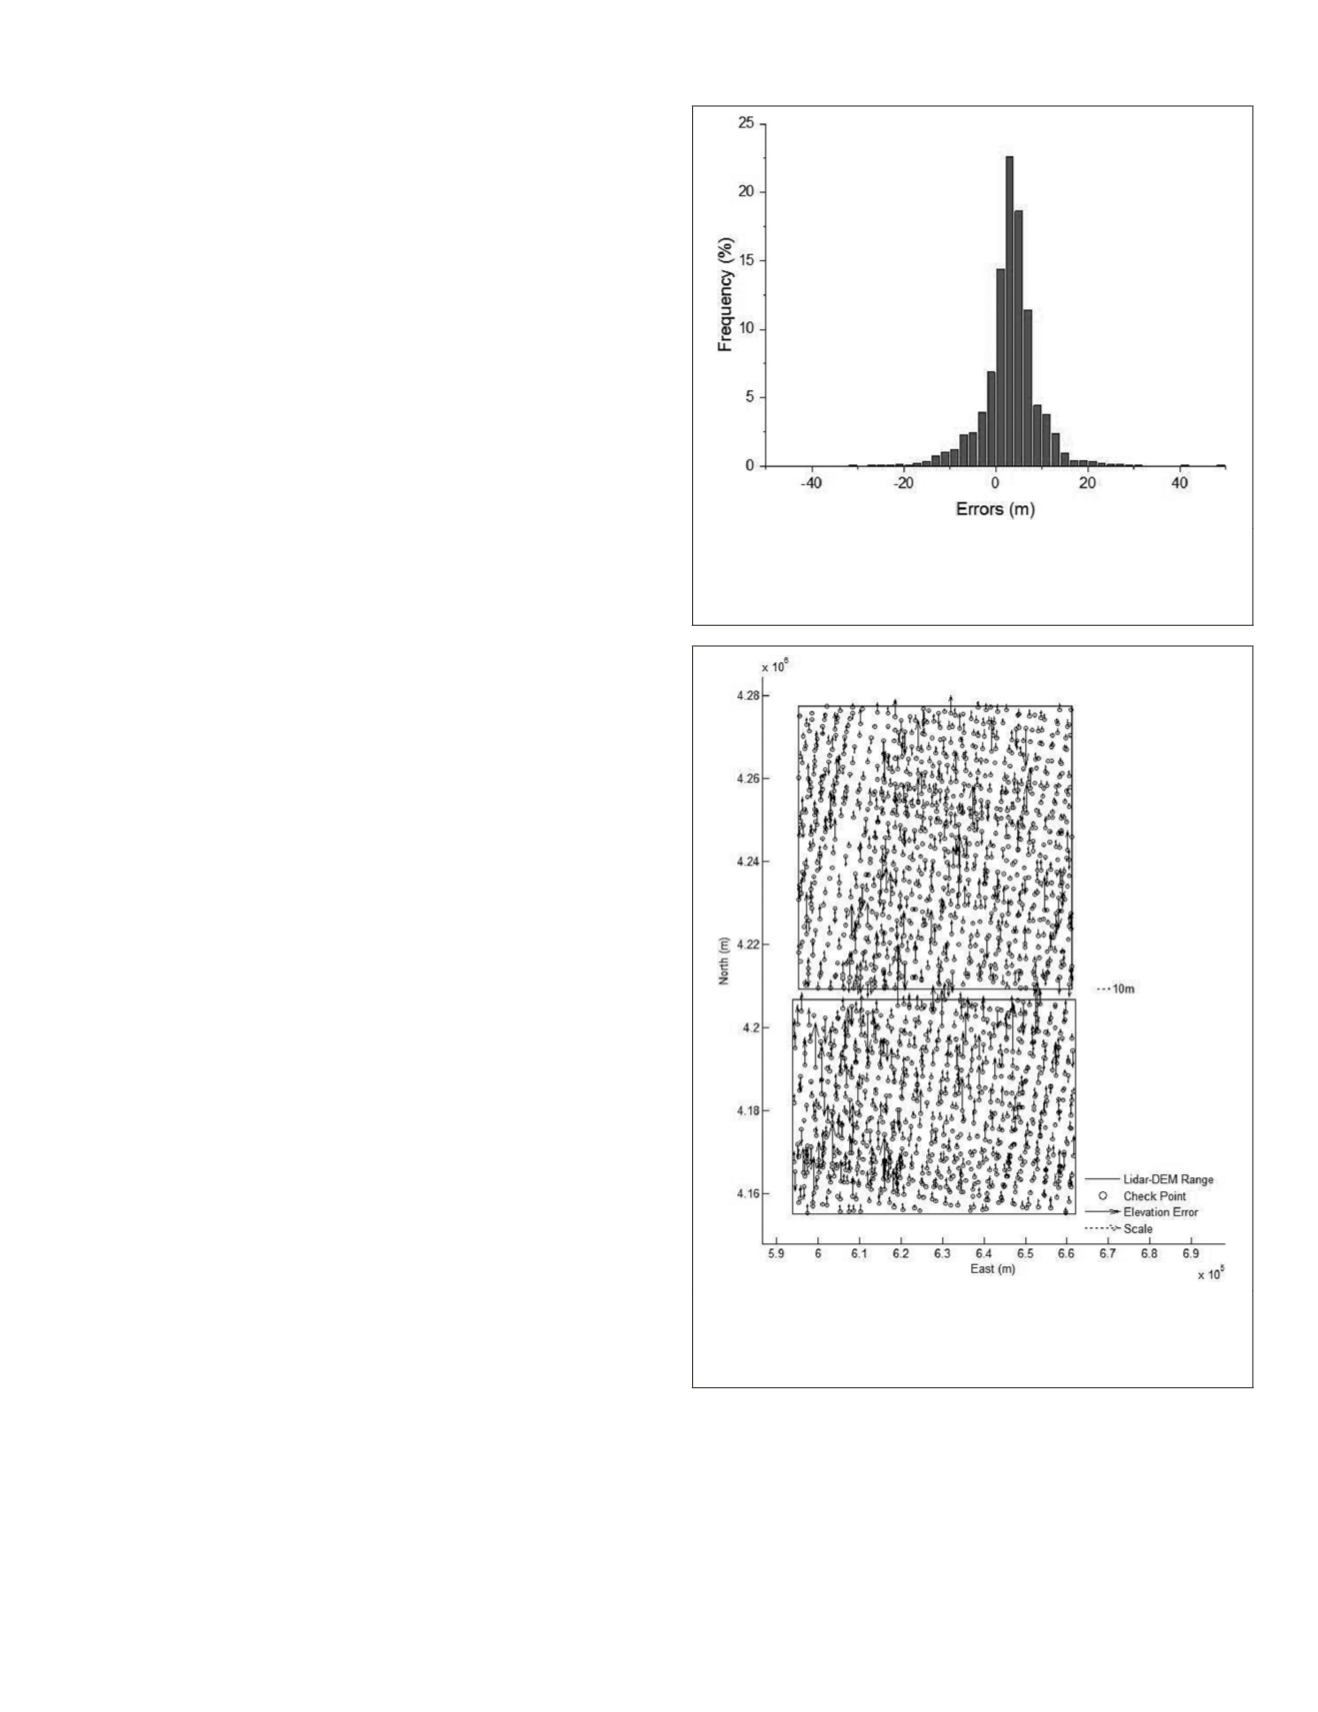
The experimental results proved that the vertical
RMSE
was
6.58 m and the maximum error was 49 m. Histograms of the
height differences between the elevation obtained by the for-
ward intersection and
LIDAR
-
DEM
were produced to illustrate
the statistical properties of the experimental data (Figure 6).
The error distribution, derived using the elevation obtained
by the forward intersection minus the elevation of the
LIDAR
-
DEM
is illustrated in Figure 7.
The elevation values obtained by the forward intersection
of forward and backward stereo images included the height
of buildings and vegetation. When the
LIDAR
-
DEM
(eliminating
the buildings and vegetation height) was used to evaluate the
vertical accuracy, the actual vertical error in the partial region
was exaggerated by visual detection and judgment. Under
this adverse condition, our results suggest that using postpro-
cessed attitude and orbit measurements, the vertical
RMSE
of
the experimental images was 6.58 m. If the effect of the height
of buildings and vegetation is eliminated, the vertical accu-
racy was close to 6 m, satisfying the vertical accuracy require-
ments of Chinese 1:50 000 topographic maps. The actual ex-
perimental accuracy matched the estimated vertical accuracy
of the images produced using post-processed attitude and
orbit measurements (i.e., 6.1 m, calculated by Equation 12)
and the correctness and reliability of the vertical accuracy es-
timation model was confirmed. Moreover, from Figures 6 and
7, we observed that elevation values of 80 percent generated
by forward intersection were higher than those of the
LIDAR
-
DEM
. This result is in agreement with the common-sense view
that
DSM
data are higher than
DEM
data for the same region.
Conclusions
The evaluation and verification of the geometric accuracy of
satellite images is fundamental task to support the application
of satellite-retrieved data. Studying the geometric accuracy of
ZY-3
satellite images without
GCP
s, this paper aimed at specific
configuration and technical indexes of the
ZY-3
satellite, and
analyzed the error sources influencing the geometric accuracy
and the error propagation rules based on a rigorous geometry
sensor model. Then, the planar and vertical accuracy evalu-
ation models without
GCP
s were deduced and the theoretical
geometric accuracy of the
ZY-3
satellite images was calculated
according to the models. Meanwhile, representative
ZY-3
im-
age data were used to verify the planar and vertical accuracy.
The theoretical accuracy deduced by the accuracy evaluation
model was basically in accordance with the practical accu-
racy value obtained in the experiment, with a planar
RMSE
of the nadir panchromatic image below 11 m, and a vertical
RMSE
of the stereo images close to 6 m. Therefore, the
ZY-3
images without
GCP
s could satisfy the 1:50 000 scale topo-
graphic mapping requirements in China. Meanwhile, it also
demonstrated that the image accuracy evaluation model was
appropriate for the
ZY-3
satellite images, with more accurate
evaluation values.
The optical mapping satellites using linear-array
CCD
with
push-broom imaging that have similar construction and tech-
nical indexes as the
ZY-3
satellite, also exhibit similar imaging
mechanisms and constructing methods of the rigorous geom-
etry sensor models. Therefore, our accuracy evaluation model
is also suitable to image accuracy evaluation of other optical
push-broom satellites.
In addition, a large number of experimental images (556
panchromatic nadir images covering an area of approximately
3,500,000 km
2
) was adopted for planar accuracy verification,
while dense check points (1,532 elevation checkpoints within
8,000 km
2
) were used to verify the vertical accuracy. Further-
more, all experimental images were acquired during a stable
normal operation period of the satellite and covered several
types of terrain. Therefore, the experimental results of the
accuracy experiment could actually reflect the accuracy of the
ZY-3
satellite images without using
GCP
s, and could supple-
ment and deepen the previous geometric accuracy verifica-
tions of the
ZY-3
satellite.
Figure 6. Histograms of the height differences between the eleva-
tion obtained by forward intersection and LIDAR-DEM. The bars
indicate the probability of the corresponding height differences,
with bar intervals of 2 m
Figure 7. Residual errors for the experimental area derived using
the elevation obtained by the forward intersection minus the
elevation of the LIDAR-DEM. The solid black arrows represent the
height errors (upward is positive and downward is negative)
PHOTOGRAMMETRIC ENGINEERING & REMOTE SENSING
December 2015
933


