classified as stable, it is expected to classify incorrectly as the
surface roughness is low for this area (see Figure 6D). In order
to understand and potentially overcome the limitations further
evaluation is necessary beyond the scope of this study.
The algorithm tends to misclassify topographic features
with sharp edges or abrupt changes in elevation (SE and NE
corner of Figure 7C and SE corner of Figure 7A). Even though,
some of the incorrectly classified areas are along these abrupt
surface changes, many inventory mapped landslides are also
along abrupt changes in elevation, especially, along
SR
-666.
Additionally, natural surface features also express abrupt
changes or high surface roughness in the terrain, which
include: riverbanks (SW corner of Figure 7C, and Figure 6C),
bluffs, streams, creeks, and high elevation changes in a short
distance. These natural features increase in surface roughness
due to erosion and geomorphological events, which cause
surface features to mimic those of landslides. Nonetheless, the
algorithm also tends to overlook topographic features found
within the boundaries of inventory mapped landslides due
to insufficient surface roughness or man-made improvements
made to the environment. Although, a
GIS
database was avail-
able and can be used to minimize misclassifications gener-
ated by the proposed algorithm, it was only used to store
geographic information of roads, rivers, creeks, residential
development, etc, and the results generated by the algorithm.
In the study area, landslides have a range of ages and
activity levels, so the surfaces of various landslides have
undergone different degrees of surface deformation and post-
failure improvement. The transportation of soil and weather-
ing over time along older slides will cause them to smoothen
and make them difficult to identify. For example, most of the
mapped landslides shown in Figure 7D are mapped incor-
rectly due to the smooth topography from an older landslide.
The removal of landslide features prevents the algorithm from
detecting and identifying the mapped landslides in this area.
The performance of the proposed algorithm assessed how
well the mapped areas coincide with the mapped landslides
(reference) in the study area. The proposed algorithm was able
to map a total of 200 locations throughout the study area. One
hundred and ten of those identified areas overlapped mapped
T
able
2. P
ercentiles
of
D
istribution
S
amples
Stable
Landslide
Surface Feature
Q
1
Q
2
Q
3
Q
1
Q
2
Q
3
Eigenvalues Ratio ln(
λ
1
/
λ
2
)
1.15
1.30
1.45
0.38
0.60
0.85
Eigenvalues Ratio ln(
λ
1
/
λ
3
)
2.32
2.47
2.61
1.57
1.80
1.99
Roughness (m)
0.03
0.04
0.05
0.07
0.08
0.11
Customized Sobel Operator (m)
0.68
0.85
1.17
1.82
2.43
3.29
Aspect (°)
11.53
13.42
15.75
23.76
40.57
66.51
Hillshade
0.05
0.06
0.07
0.09
0.10
0.12
Slope (°)
3.45
4.02
4.79
5.51
6.74
8.47
Resultant Length of Orientation Vectors
0.35
0.49
0.69
3.91
6.54
10.56
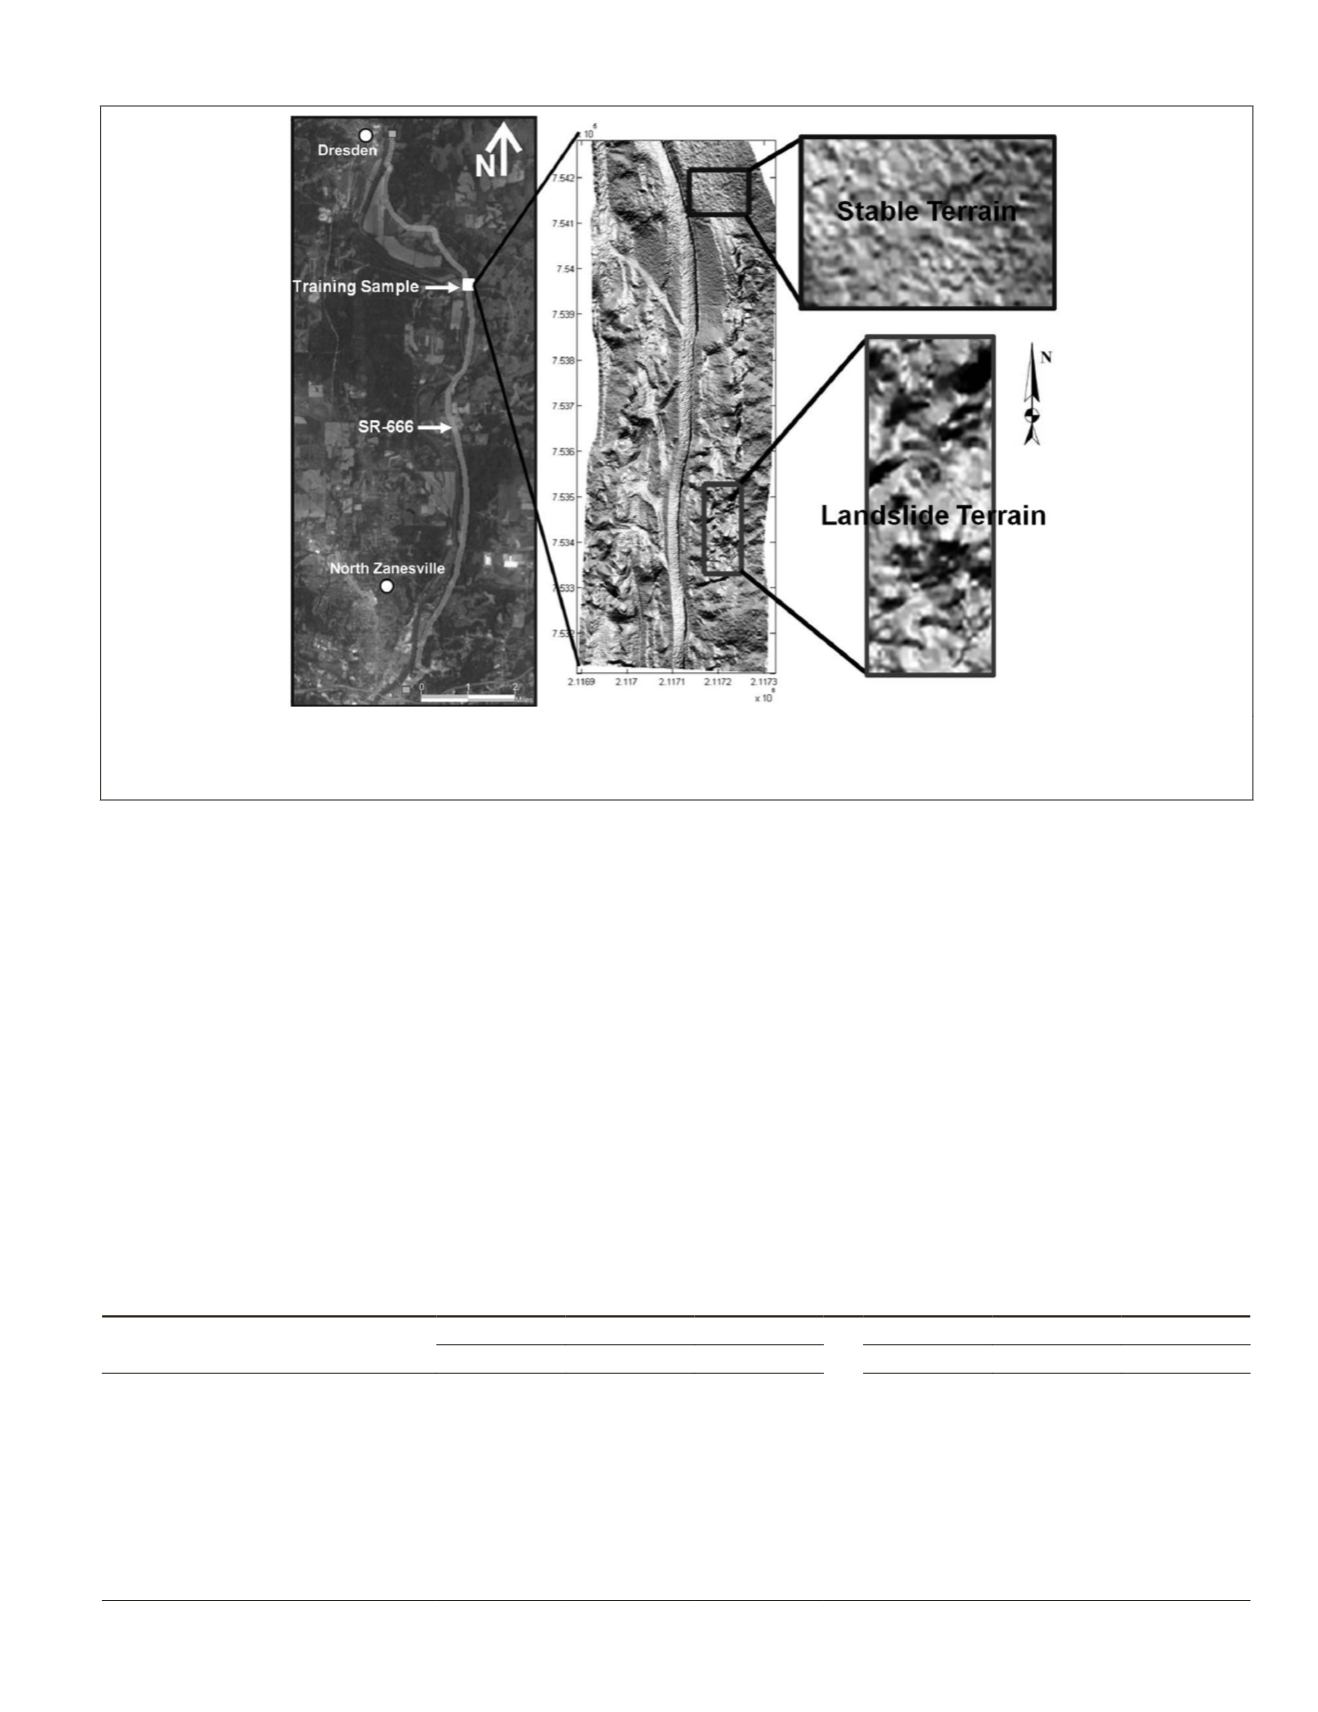
Figure 4. Lidar-derived hillshade map of SR-666, Zanesville, Ohio study area with the entire training sample used to calibrate the SVM
algorithm outlined on top, and bottom, for stable and landslide terrain, respectively. The map is displayed in US survey feet for the
State Plane Coordinate System, Ohio South Zone.
PHOTOGRAMMETRIC ENGINEERING & REMOTE SENSING
March 2015
245


