to automatically map terrain with surface features indicative
of landslide activity, we analyze the surface features extracted
as single observations with nine dimensions (surface features
described earlier) to determine if the observation is repre-
sentative of landslide activity for each cell in the
DEM
. If it
is, then it is mapped as landslide susceptible, otherwise, it is
mapped as stable. Each cell in the
DEM
is considered a nine-
dimensional observation.
Support Vector Machine
SVM
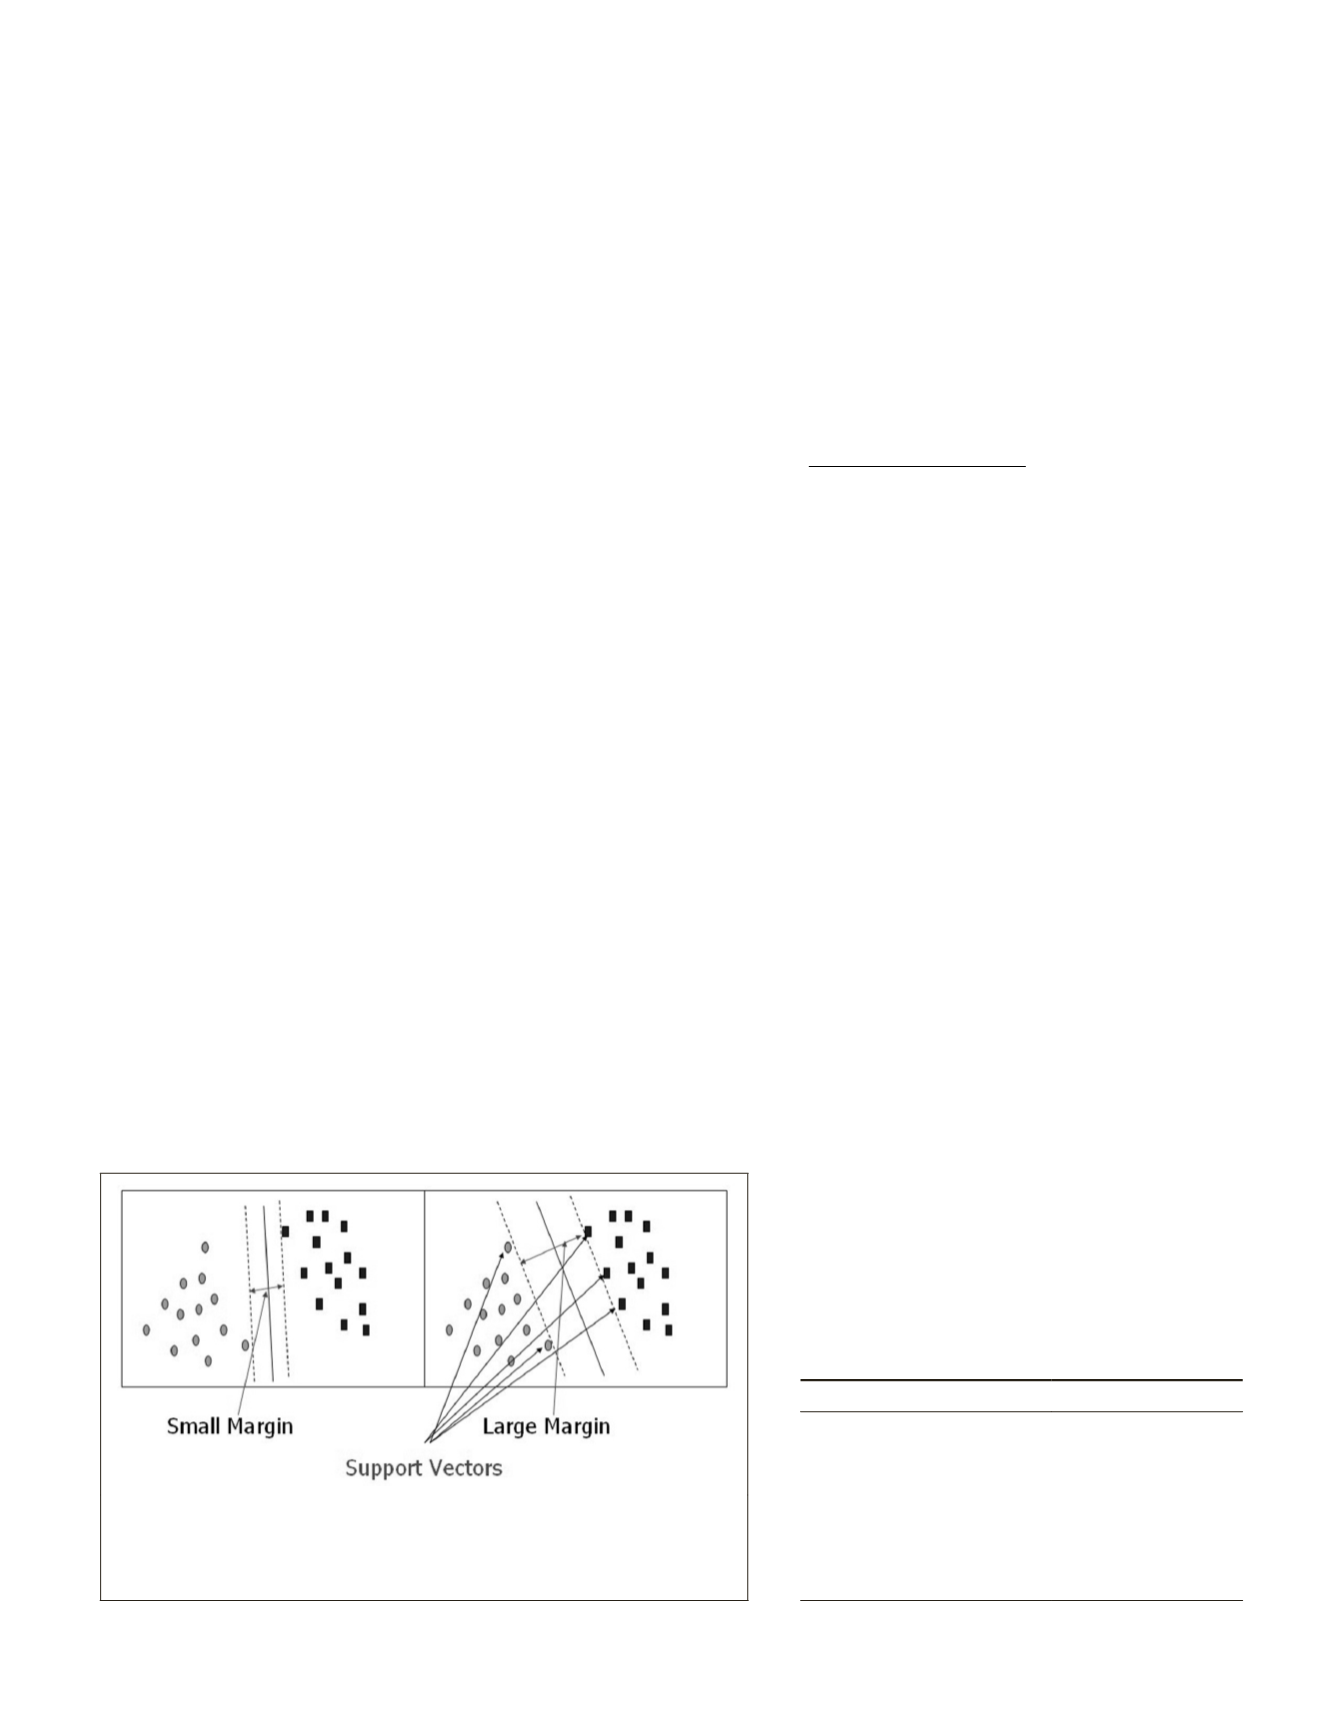
was developed by Vladimir Vapnik (1995). The idea of
SVM
is to determine the optimal hyperplane for linearly sepa-
rable patterns (see Figure 3). If the patterns are not linear then,
the data is projected into a higher dimensional space using a
kernel. Support vectors are selected to delineate the two class-
es and maximize the margin between them. Support vectors in
general are the most difficult data points to classify, thus, lying
closest to the decision surface (Tien Bui
et al.
, 2012).
SVM
was chosen for its advantages which are: its effective-
ness in high dimensional spaces, it utilizes a subset of the
training sample in the decision function (support vectors),
various kernel functions may be applied for the decision func-
tion, and it works well when there is a small sample available
for training. For these reasons, it was the prime consideration
for classification. In general, the
SVM
algorithm is calibrated
through a sample set of two classes enclosing all features
desired. The two classes are landslide and stable terrain, and
the aforementioned surface features are those used in our
case. After calibration is complete, the algorithm is tested on
an independent data set to evaluate its performance, a lidar-
derived
DEM
in our case.
Flat Terrain Filtering
Landslides have shown to occur more often on steeper slopes
(Gomez and Kavzoglu, 2005). Locations are safer in terms of
potential failures where the slope is near flat. Therefore, as
the slope increases so does the probability of failure. Table
1 illustrates unstable slopes for various types of mass move-
ment taken from Soeters and van Westen (1996).
Given the ranges of slope instabilities in Table 1 and those
found in our study area, it was determined that slopes (15°
≥
)
would be stable.
Conditional Dilation/Erosion Filter
Mathematical morphology is a method used to extract useful
features found within an image that characterize shapes of
objects (Gonzalez and Woods, 2002). Furthermore, it is help-
ful in filtering, which is our interest. Two common morpho-
logical operations are dilation and erosion. Dilation expands
the shapes found within an image, while erosion removes
them; both draw conclusions from a given structuring ele-
ment (e.g., kernel). In our algorithm we used a conditional
dilation/erosion filter as we wanted the components to satisfy
a size threshold (Shapiro and Stockman, 2000). The filter was
designed as a sliding window of size
n
×
n
(
n
must be an odd
integer), with a given threshold, to determine if the center cell
should be dilated or eroded, with respect to the local neigh-
borhood, see Equation 5:
#
#
of failedcells
of total cells inwindow
Threshold
≥
(5)
The effect of the window size and threshold were tested
and evaluated by having varying window widths between 3
and 21 cells and varying thresholds between 50 percent and
100 percent. After assessing potential thresholds, the most
suitable window size and threshold found was 11 × 11 (5 m
× 5m) and 60 percent, respectively. This particular window
size and threshold did not distort the information produced
from the classification algorithm. It only dilated and eroded
the classification results as intended. For these reasons, the
threshold and window size selected were subsequently used.
Noise Suppression
The analysis of clusters is a vital component of feature extrac-
tion. The importance of this step is to analyze clusters and
suppress noise. Small regions do not provide useful informa-
tion; therefore, they are not of interest and are ignored. The
importance of determining a good threshold is so that the
noise level is minimized and useful information is not lost.
In our approach clusters of cells classified as landslide terrain
are analyzed and evaluated to determine if the cluster will be
classified as landslide or stable given the following criterion:
Cluster Area
≥
Minimum Area Threshold
(6)
The minimum area to be considered landslide susceptible
was tested and evaluated by having varying areas of 50 to
250 m
2
. This range was selected after evaluating the mini-
mum size of the mapped landslides provided by the reference
inventory map, which was 200 m
2
. After evaluating potential
thresholds, it was determined that 150 m
2
, was the
most appropriate threshold, for this reason, all clus-
ters less than 150 m
2
were ignored and considered as
noise. The criterion selected will allow for clusters
of said size to be mapped as landslide susceptible,
additionally, minimizing the probability of small
landslides being overlooked.
Figure 3. The rectangles and ovals represent the data points, the solid
line is the (hyperplane) selected to divide the two classes, and the dashed
lines define the distance between the hyperplane line and the support
vectors from Sherrod, 2008.
T
able
1. S
lope
I
nstability
for
M
ass
M
ovement
T
ype
Mass Movement Type
Slope Instability
Fall and Topple
20 °- 30°
Rotational Slide
20° - 40°
Lateral Spread
< 10°
Mudslide
15° - 25°
Earth flow
> 25°
Debris avalanche
> 35°
PHOTOGRAMMETRIC ENGINEERING & REMOTE SENSING
March 2015
243


