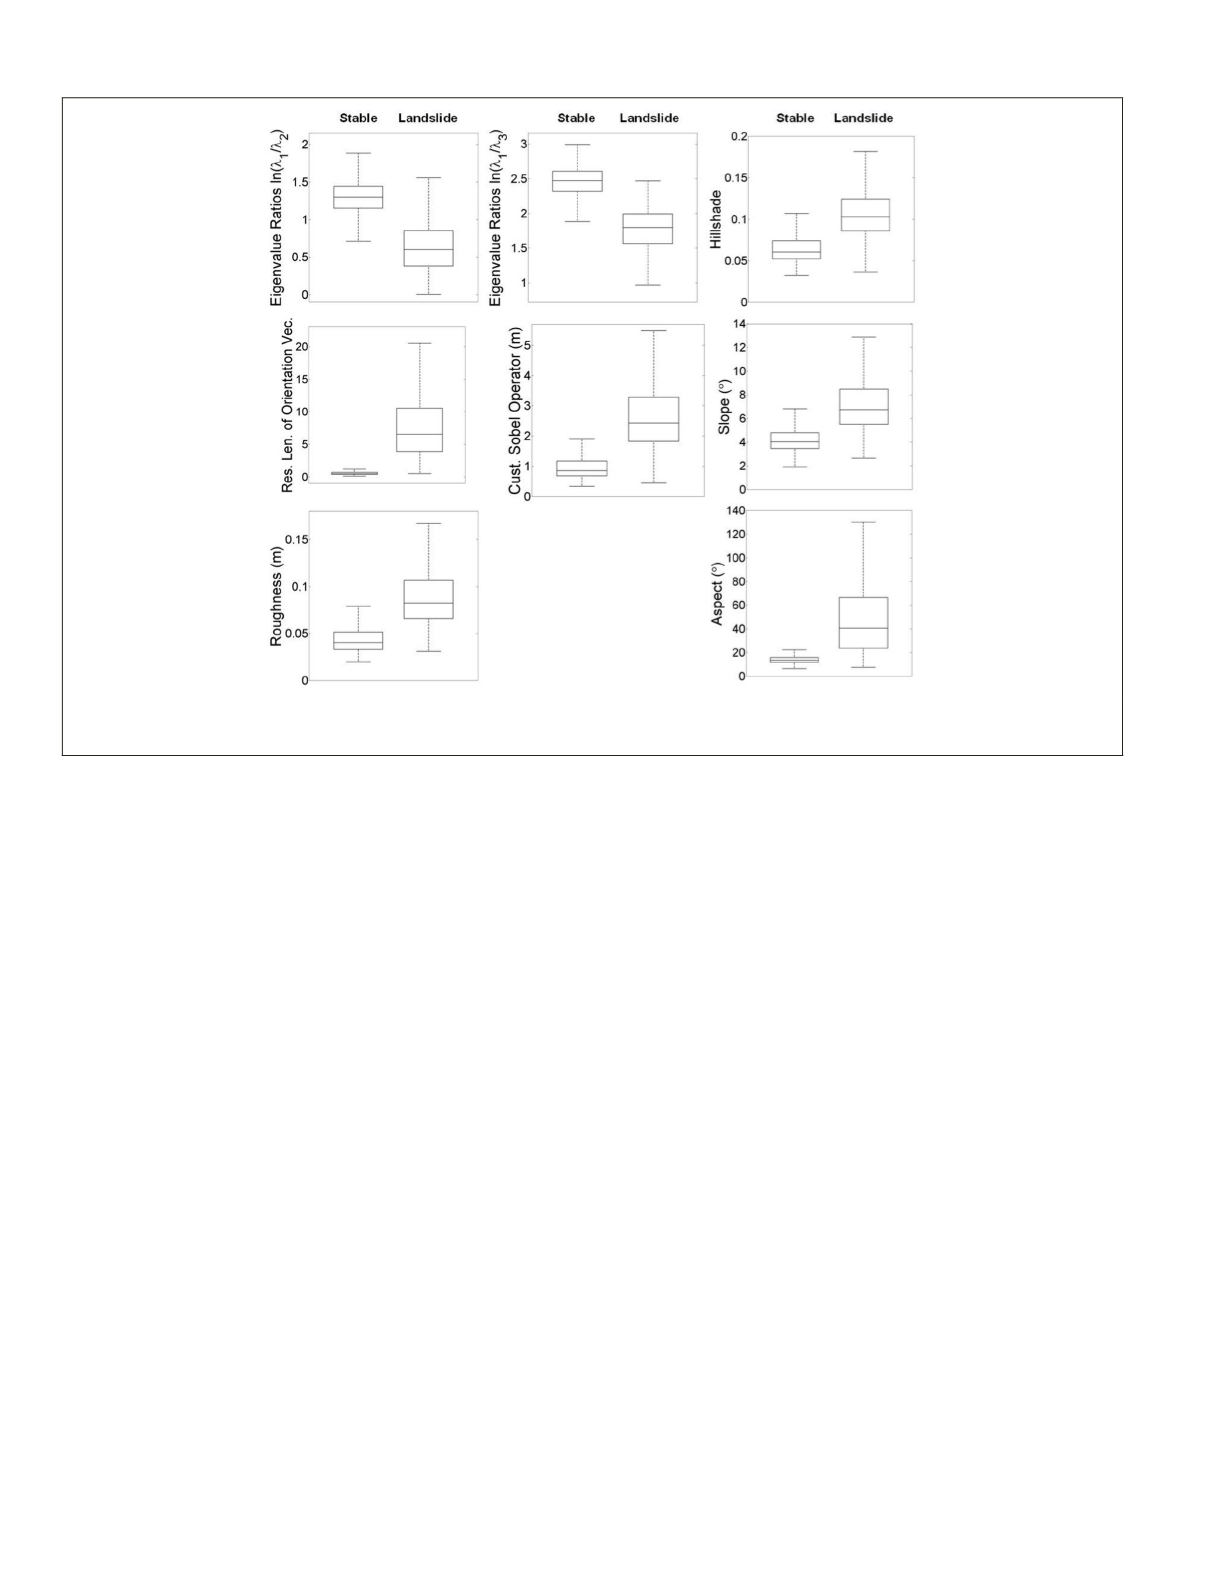
Figure 5. Distribution of training samples before being normalized between [-1 1], where, stable and landslide terrain are represented
on the left and right, respectively, for each surface feature extracted.
Results
Training Sample Evaluation
To determine characteristics of landslide surface features
in the study area, we first select a representative patch of a
mapped landslide and stable terrain. We use a section 450 m
north of MM9 as representative patches (see Figure 4). The
size of the representative patch was 30 × 40 m (1,200 obser-
vations) for stable and 60 × 25 m (1,500 observations) for
landslide terrain. The representative terrain elected was less
than 1 percent of the entire study area. Next, we compute the
surface features for each patch of terrain. Figure 5 shows the
distribution of the samples elected for each surface feature.
The topographic variability is higher for landslide than stable
terrain. These patterns indicate that the landslide surface in
our study area tends to experience higher amounts of surface
deformation, meaning, it is rougher in texture. Earth processes
that can generate such behavior are those of mass movement
found in landslides.
The distributions in Figure 5 can be described as follows:
the central mark in each box is the median (Q
2
), the limits
of the box are the 25
th
(Q
1
) and 75
th
(Q
3
) percentiles of the
samples, the interquartile range (IQR) is equal to Q
3
− Q
1
,
the dashed line (whiskers) extend to the typically used Q
1
-
1.5(IQR) and Q
3
+ 1.5(IQR) range which is about ±2.7σ and 99.3
percent of the data, if the data are normally distributed. The
remaining samples not lying within these limits are considered
outliers (are not plotted). It is expected to observe outliers as
not all landslide and stable terrain will have complete coverage
of surface features representative of each. Therefore, it is pos-
sible to observe a few instances of landslide surface features in
stable terrain and vice versa. These instances can be caused by
noise in the data or irregularities observed within the terrain.
The representative patches demonstrate that 75 percent
or more of the training samples are linearly separable for all
surface features (see Figure 5). It was found that the eigenvalues
ratio (see Table 2) express the behavior described in Mckean and
Roering (2004), where the ratios are lower for landslide than sta-
ble terrain. Additionally, roughness, customized Sobel operator,
aspect, hillshade, slope, and resultant length of orientation vec-
tors, all experienced higher topographic variability (see Table 2)
for landslide terrain as described in McKean and Roering (2004),
and Glenn
et al.
, (2006). The variation of the surface features ex-
tracted is less for stable terrain for all surface features (Figure 5).
This behavior is expected as stable terrain will experience lower
rates of mass movement, therefore, most stable surface features
are expected to express the same behavior.
Classification Performance Evaluation
The mapped locations will vary for each area, which reflects
the variation in the topography (see Figure 6A, 6B, 6C, and
6D). Areas that are smooth will go undetected by the pro-
posed algorithm (SW corner Figure 6B, and West section
of Figure 6C), while areas that are rough will be mapped as
landslide susceptible (East section of Figure 6A, and Figure
6B). The rough areas shown in Figure 6 tend to correspond to
those mapped in Figure 7. Additionally, the areas identified
as landslide susceptible by the proposed algorithm tend to
coincide to those mapped locations provided by the reference
inventory map, verifying that the proposed
SVM
model can
delineate landslide terrain (see Figure 7).
In our study area, the proposed algorithm is capable of iden-
tifying 84 percent of the inventory map landslides (Figure 7A,
7B, 7C, and 7D). This defines that the training samples elected
for calibrating the classification model were representative of
the landslide terrain throughout the study area, thus, identifying
a high percentage of the landslides. As anticipated earlier, some
topographic features display characteristics of stable terrain
within a landslide and vice versa. In particular (Figure 7D), a
vast majority of the inventory mapped landslides are incorrectly
244
March 2015
PHOTOGRAMMETRIC ENGINEERING & REMOTE SENSING


