irrigation status of farms. Farms receiving
≤
0.1 ML within a
season were considered not actively managed and were ex-
cluded from comparison. On the other hand, the “estimated”
irrigation status of farms was determined, whether or not there
was any area (>0.1 ha) identified as S4 (irrigated pasture/crop).
Table 4 shows the validation results of farms within the
CGID
.
Altogether, 2,528 farms were compared. Producer’s and user’s
accuracies were calculated (Congalton, 1991; Foody, 2002;
Story and Congalton, 1986). Overall accuracy was 88.4 percent.
Discussion
This study attempted to demonstrate the use of day-time
relative temperature differences to distinguish between
“irrigated” and “non-irrigated” areas. Surface temperature
derived from satellites such as Landsat-7 and -8 is suitable,
both in terms of coverage and spatial resolution, although the
temporal frequency can be limited on some occasions. The
coarse resolution thermal bands (e.g., MODIS and AVHRR) are
available at high temporal frequency but these are not ideal
for farm scale studies. However, these are useful for regional
or landscape level. Diurnal differences of surface temperature
have been suggested to detect irrigated areas and measure
irrigation intensity (Ozdogan
et al
., 2010). However, the night-
time temperature data is not readily available at an appropri-
ate resolution.
There is a long tradition of relating surface temperature with
vegetation in agricultural studies (Idso
et al
., 1981; Moran
et
(a)
(b)
(c)
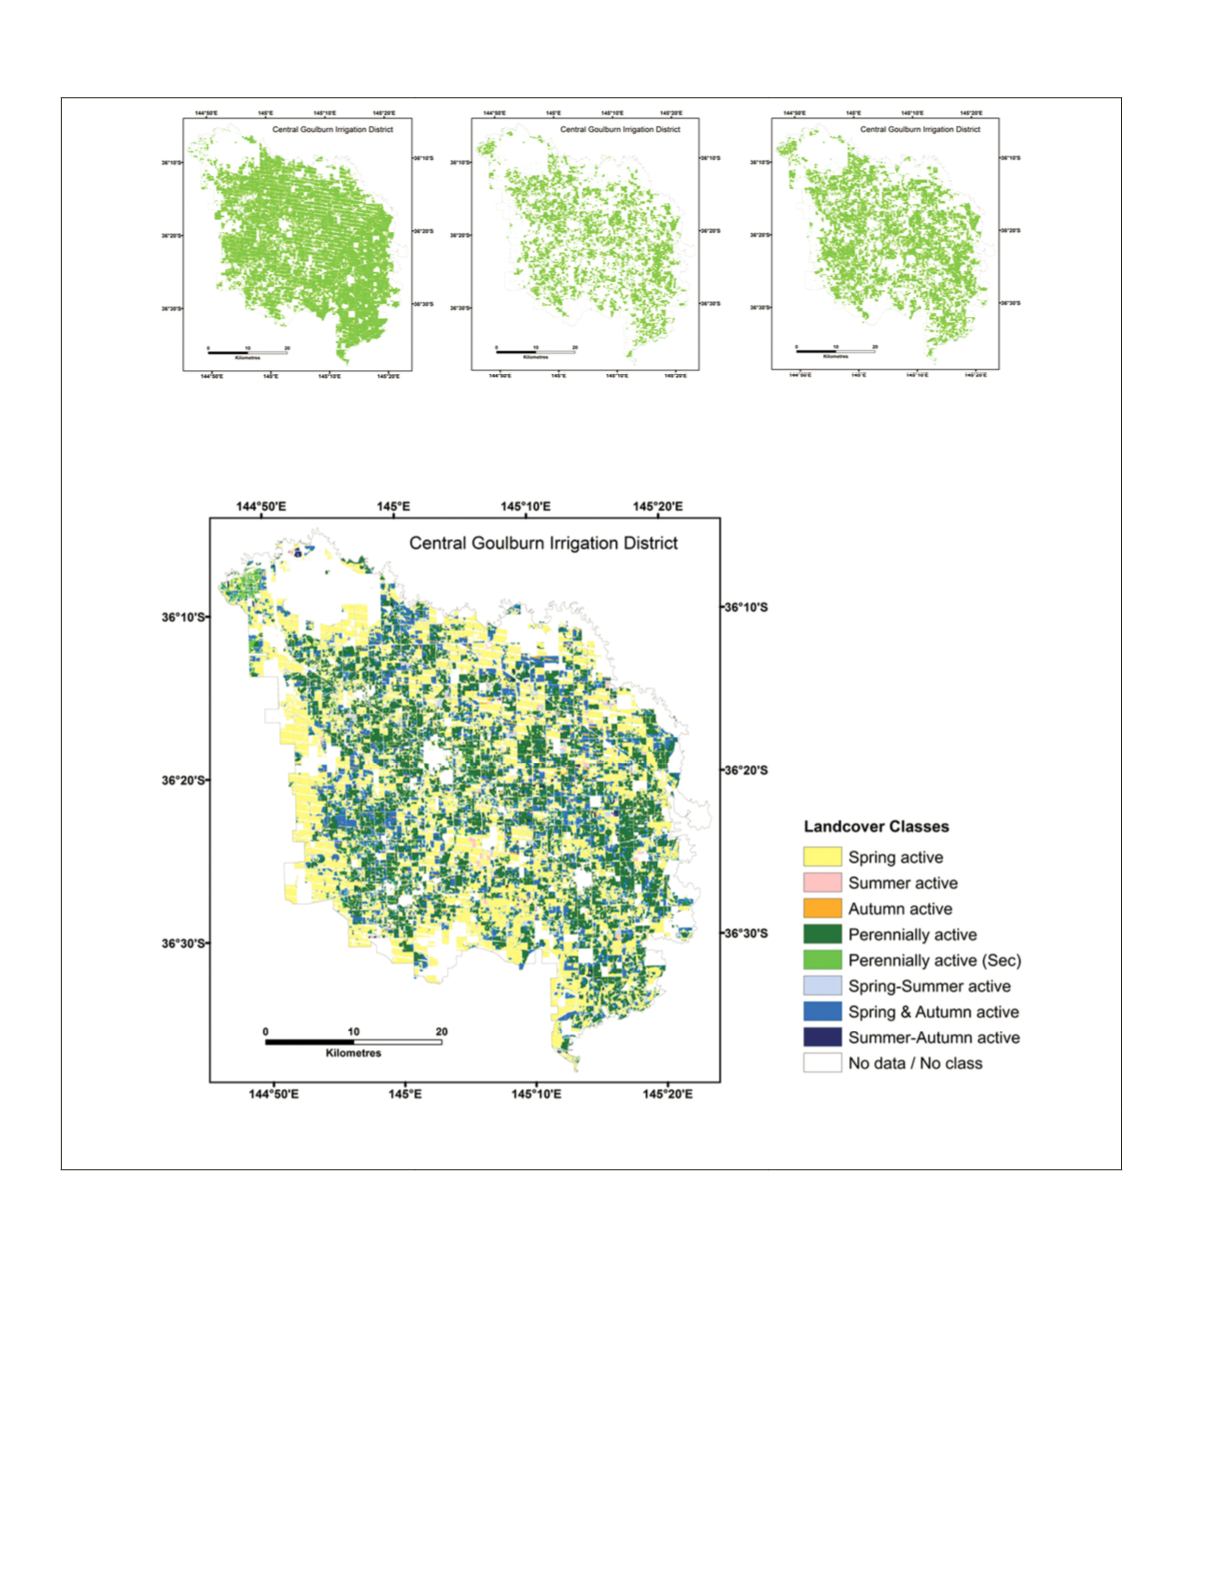
Plate 2. Spatial distribution of actively growing vegetation identified as irrigated crop/pasture: (a) Spring 2012, (b) Summer
2012/2013, and (c) Autumn 2013.
Plate 3. Map showing irrigated land cover classification of 2012/2013 based on satellite imagery of Landsat-7 and
aster
. This graphic
is a composite result of three seasons.
236
March 2015
PHOTOGRAMMETRIC ENGINEERING & REMOTE SENSING


