cirro- or alto-clouds existed near the upper left corner and
the lower portion of the image. Although there were various
types of land cover, the dominant type was forest. It should be
pointed out that an important reason to select such a subim-
age was that the area was almost cloud-free on 30 November
2013 when the Landsat-8 flew over the area. The time lapse
of 16 days was the shortest for the satellite. Such a pair
was hardly available for Sichuan basin due to the constant
overcast sky. Thus, the November image could be treated as
“truth” in the validity assessment of the algorithm.
Results
Atmospheric Correction
After the atmospheric correction, the input image became
IMG1
. In comparison of band-by-band image pairs before
and after the correction, the reduction in bright features was
visually notable (Figure 2a c.f. Figure 1a; Figure 2b c.f. Figure
1b; Figure 2c c.f. Figure 1c; Figure 2d c.f. Figure 1d; Figure
2e c.f. Figure 1e). The correction of the path radiance from
atmosphere as well as reflectance from clouds was attributed
to causing the reduction. Values of mean and one standard
deviation of reflectance values in each band were summarized
in Table 1.
Removal of Cirrus Clouds Using Band 9
Band 9 was shown in gray scale (Figure 3). Cirrus clouds
could be noted as bright signatures. In comparison, some
cirrus clouds identified by Band 9 were not visible in Figure
2. Thus, the addition of Band 9 offered the opportunity for
the identification and removal of the clouds. After the cirrus
cloud removal using Equation 2,
IMG1
became
IMG2
. Re-
flectance values of Bands 1 through 5 of
IMG2
were shown
in Figure 4. Mean reflectance values of Bands 1 through 5
decreased band-by-band (Table 1). Therefore, the number of
pixels having large reflectance values caused by thin clouds
decreased. The distribution of reflectance values in each band
was shifted towards smaller values (e.g., Figure 5). Due the
reduction in one standard deviation, the spread of the distri-
bution became narrowed (e.g., Figure 5) as well.
Removal of Remaining Thin Clouds with
QA
Band
Of 160,000 pixels, the numbers of pixels with 00, 01, 10, and
11 of Bits 14 and 15 in
QA
band were 0 (0.0 percent), 111,902
(69.9 percent), 20,080 (12.6 percent), and 28,018 (17.5 per-
cent), respectively. Recoding a pixel of 01 as a no-cloud pixel,
and a pixel of 10 or 11 as a cloud pixel, one could create a
binary mask consisting of no-cloud and cloud pixels. Then,
for each of the cloud pixels of
IMG2
, the reflectance values
in Bands 6 and 7 were extracted. Using Equations 3, 4, and
5, we produced temporary cloud data,
TMP1
. After apply-
ing a Gaussian smoothing filter to
TMP1
,
TMP2
was derived.
Finally, the cloud removed image,
IMG3
was obtained by
subtracting
TMP2
from
IMG2
.
IMG3
was shown in Figure 6.
Thin clouds were almost removed completely band-by-band
(Figure 6, c.f. Figure 2). The results clearly showed the ef-
fectiveness of the developed algorithm. Values of mean and
standard deviations further decreased in Bands 1 through 4
(Table 1). With close examination (e.g., Figure 5), the distribu-
tion of the gray values shifted towards small values might be
less when the gray values were low, but slightly more when
the gray values were large. Such change patterns in distribu-
tion were attributed to the factor that thin clouds should be
predominately in
IMG2
and be of high reflectance values in
visible bands. Values of mean and one standard deviation of
Band 5 were the same (Table 1). The thin-cloud removal in
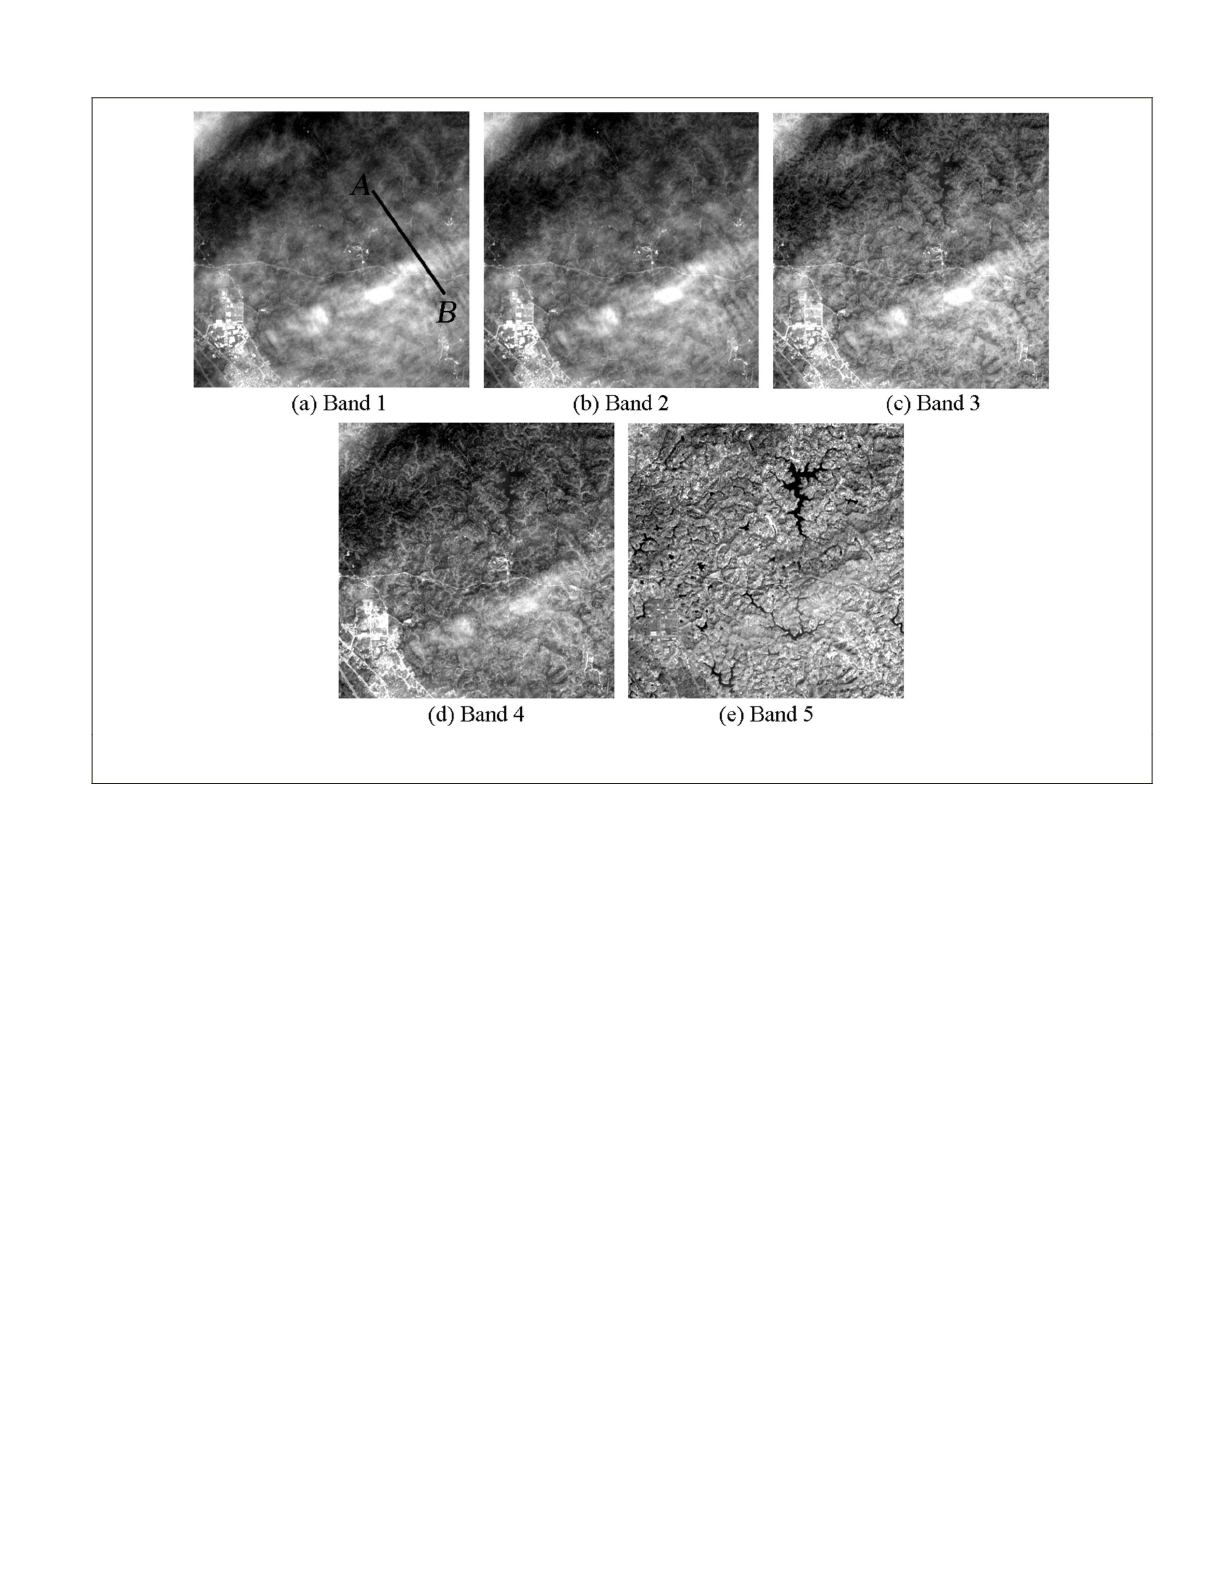
Figure 1. Reflectance values of a Landsat-8 subimage in gray scale near Ziyang, Sichuan Province, China; thin clouds were scattered: (a)
Band 1, (b) Band 2, (c) Band 3, (d) Band 4, and (e) Band 5. A transect,
AB
is marked in (a).
PHOTOGRAMMETRIC ENGINEERING & REMOTE SENSING
September 2015
723


