bands, the reduction was anticipated. In contrast, the influ-
ence of thin cloud on Band 5 (Figure 7e) was smaller due to
the long wavelength of Band 5 as compared to wavelengths in
visible bands. Thus, differences in reflectance values for Band
5 were small. (Incidentally, this could be a piece of evidence
that thin clouds should be nearly transparent to short-wave-
length infrared (
SWIR
) Bands 6 and 7 because wavelengths of
Bands 6 and 7 are longer than that of Band 5.)
Verification of the Algorithm
The study area was nearly cloud-free on 30 November 2013.
The Landsat-8 image acquired on that day was used as the
reference to verify the algorithm. Because both images were
acquired only 16 days apart and in late fall, the temporal
change in surface reflectance should be minimal. After atmo-
spheric correction, reflectance values of Bands 1 through 5
of the November image (called as
IMG
NOV
) are shown (Figure
8); it was 400 columns × 400 rows, and there were almost no
clouds. Band 9 of
IMG
NOV
was shown in Figure 8f. The pres-
ence of cirro-clouds was much less in Figure 8f than in Figure
3 (the December image). The spatial correlation coefficient of
both Band 9s was -0.04. In the
QA
band of the November im-
age, numbers of pixels with 00, 01, 10, and 11 of bits 14 and
15 were 0 (0.0 percent), 149,801 (93.6 percent), 5,997 (3.7 per-
cent), and 4,202 (2.6 percent), respectively. Thus, the cloud
identified by the
QA
band was much less in the November
image than the December image. After the recoding of a pixel
of 01 as a no-cloud pixel, and a pixel of 10 or 11 as a cloud
pixel, a no-cloud/cloud mask was created for the November
image. The spatial correlation coefficient of the November
and December masks was 0.25. Therefore, the selection of
the November image as the reference should be not only
reasonable but also valid. The spatial correlation coefficients
of pairs
IMG1
and
IMG
NOV
,
IMG2
and
IMG
NOV
, and
IMG3
and
IMG
NOV
for cloud pixels were given in Table 3. The sequential
increase in coefficients would validate the algorithm. The co-
efficients ranged between 0.84 and 0.88 for
IMG3
and
IMG
NOV
.
(The spatial correlation coefficients of pairs
IMG1
and
IMG
NOV
,
IMG2
and
IMG
NOV
, and
IMG3
and
IMG
NOV
for the entire image
were given inside (.) as reference.)
Discussion
Validity of the Find/Replacement Assumption Using Bands 6 through7
Pairs of pixels with similar reflectance in Bands 6 and 7 are as-
sumed to have the same or similar reflectance values in Bands
1 through 5. One possible way to test the assumption would
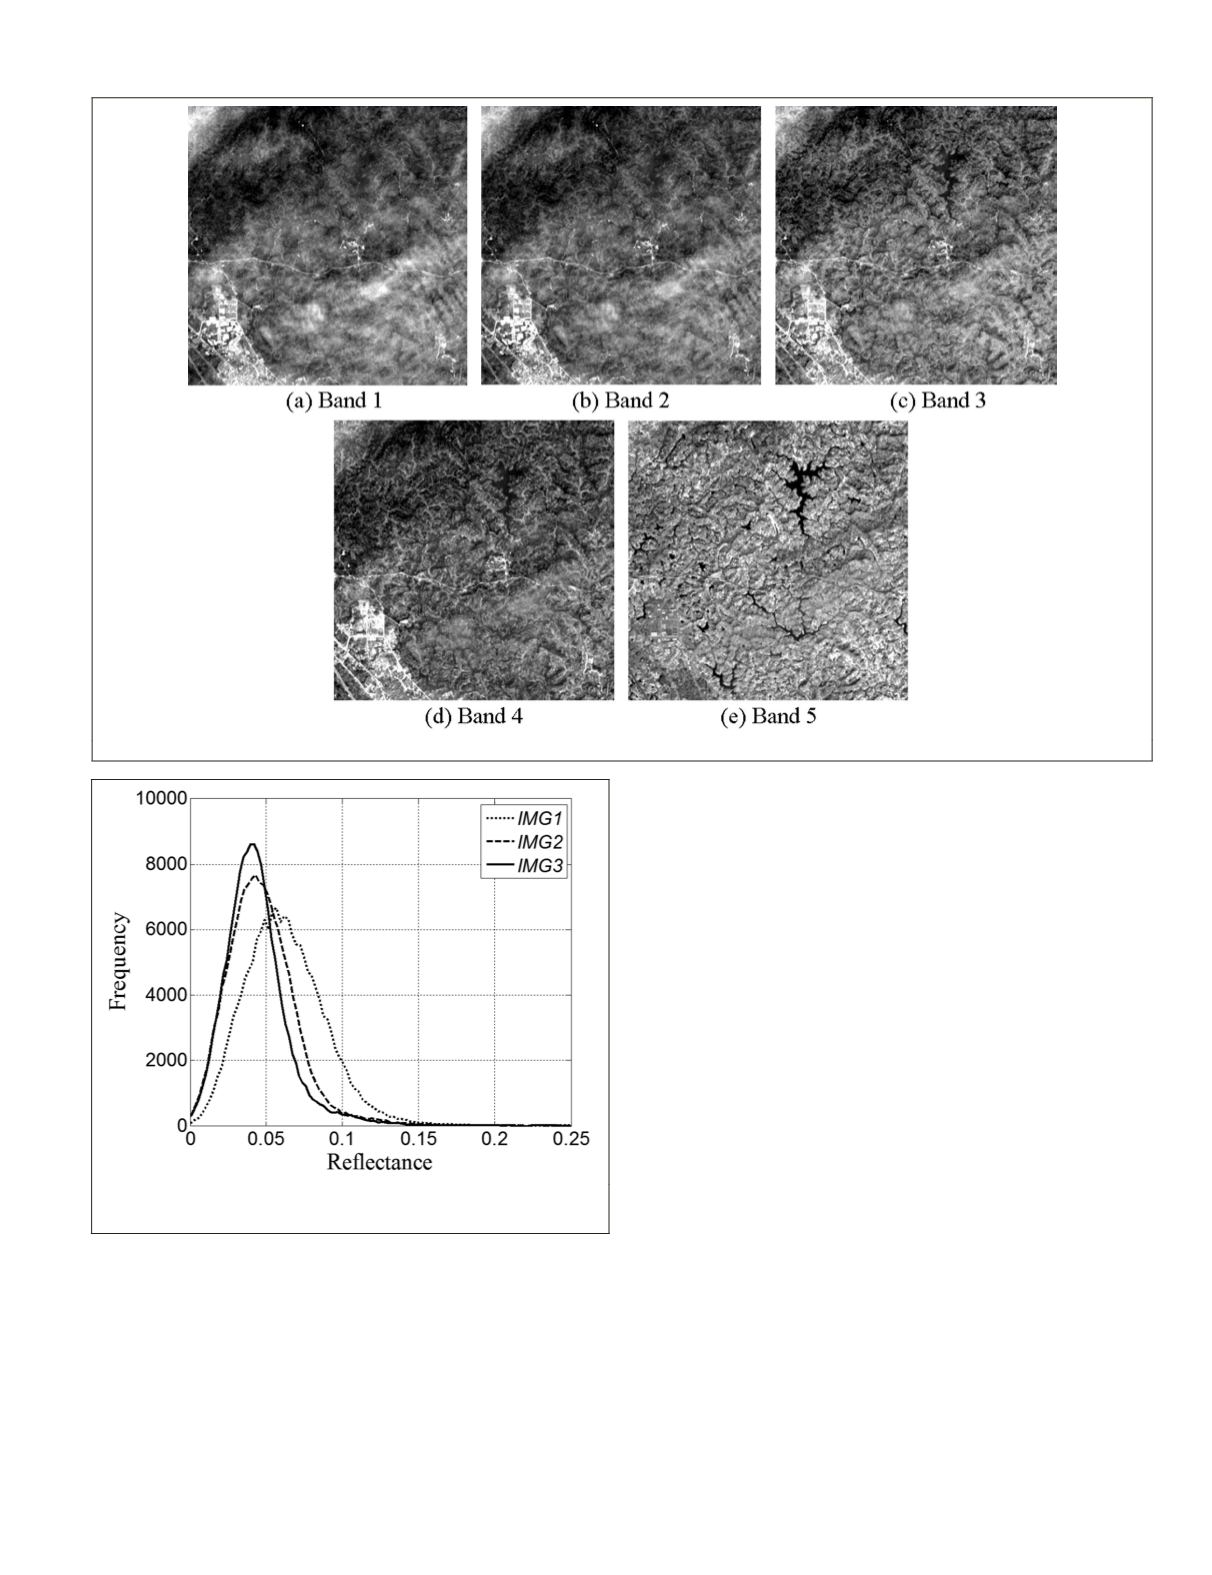
Figure 4. Reflectance values of
IMG2
that is after the cirrus cloud removal: (a) Band 1, (b) Band 2, (c) Band 3, (d) Band 4, and (e) Band 5.
Figure 5. Histograms of Band 4 of
IMG1
,
IMG2
, and
IMG3
are
shown as dotted, dashed, and solid lines, respectively.
PHOTOGRAMMETRIC ENGINEERING & REMOTE SENSING
September 2015
725


