this step had little effect on reflectance values of Band 5. In
summary, the visual and quantitative results have suggested
the validity of the developed algorithm.
Algorithm Assessment along A Transect
The validity of the algorithm has been assessed for the entire
image. It should be of interest to evaluate the performance of
the algorithm spatially. Along transect
AB
(Figure 1a), reflec-
tance values of
IMG1
(shown as dotted lines),
IMG2
(as dashed
lines), and
IMG3
(as solid lines) were plotted for Bands 1
through 5 (Figure 7a through 7e). Pixels from #1 to roughly
#125 along the transect were almost free of clouds. Differ-
ence in reflectance values of the pixels was averaged (Table
2). Mean values before and after the removal of cirrus clouds
were in the order of about 1 hundredth. The dashed line (be-
fore using
QA
band) and solid line (after using
QA
band) were
almost identical. This was because reflectance values of Bands
1 through 5 were directly output if no cloud was detected
based on values of bits 14 and 15 in
QA
band. The means
were in the order of 1 to 3 thousandths (Table 2). Because the
change of reflectance value before and after the removal of cir-
rus clouds was almost one order of magnitude larger than that
before and after using
QA
band, Band 9 was indeed valuable.
The importance of Band 9 should not be underestimated even
in areas identified as cloud-free by
QA
band.
Of cloudy pixels (from about #125 to #250), there was
noticeable successive reduction in reflectance values in Bands
1 through 4 after the cloud removal using Band 9 and then
QA
band (Figure 7a through 7d)). Difference in reflectance values
of the pixels was also averaged in Table 2. Since thin cirro-
and alto-clouds were high in reflectance values for visible
Figure 3. Reflectance values of Band 9.
T
able
1. D
escriptive
S
tatistics of
R
eflectance
V
alues
for
IMG1
,
IMG2
,
and
IMG3
Band 1 Band 2 Band 3 Band 4 Band 5
Mean
IMG1
0.044 0.033 0.053 0.062 0.200
IMG2
0.029 0.018 0.038 0.047 0.185
IMG3
0.022 0.012 0.034 0.043 0.185
One
stdev.
IMG1
0.027 0.026 0.024 0.027 0.057
IMG2
0.022 0.021 0.019 0.023 0.055
IMG3
0.017 0.017 0.016 0.021 0.055
T
able
2. M
eans
of
D
ifferences
in
R
eflectance
V
alues
along
T
ransect
AB
Pixel #
Band 1 Band 2 Band 3 Band 4 Band 5
1 to 125
IMG1
–
IMG2
0.013 0.012 0.012 0.013 0.013
IMG2
–
IMG3
0.003 0.002 0.002 0.001 0.001
126 to
250
IMG1
–
IMG2
0.029 0.029 0.028 0.027 0.025
IMG2
–
IMG3
0.024 0.018 0.012 0.011 -0.005
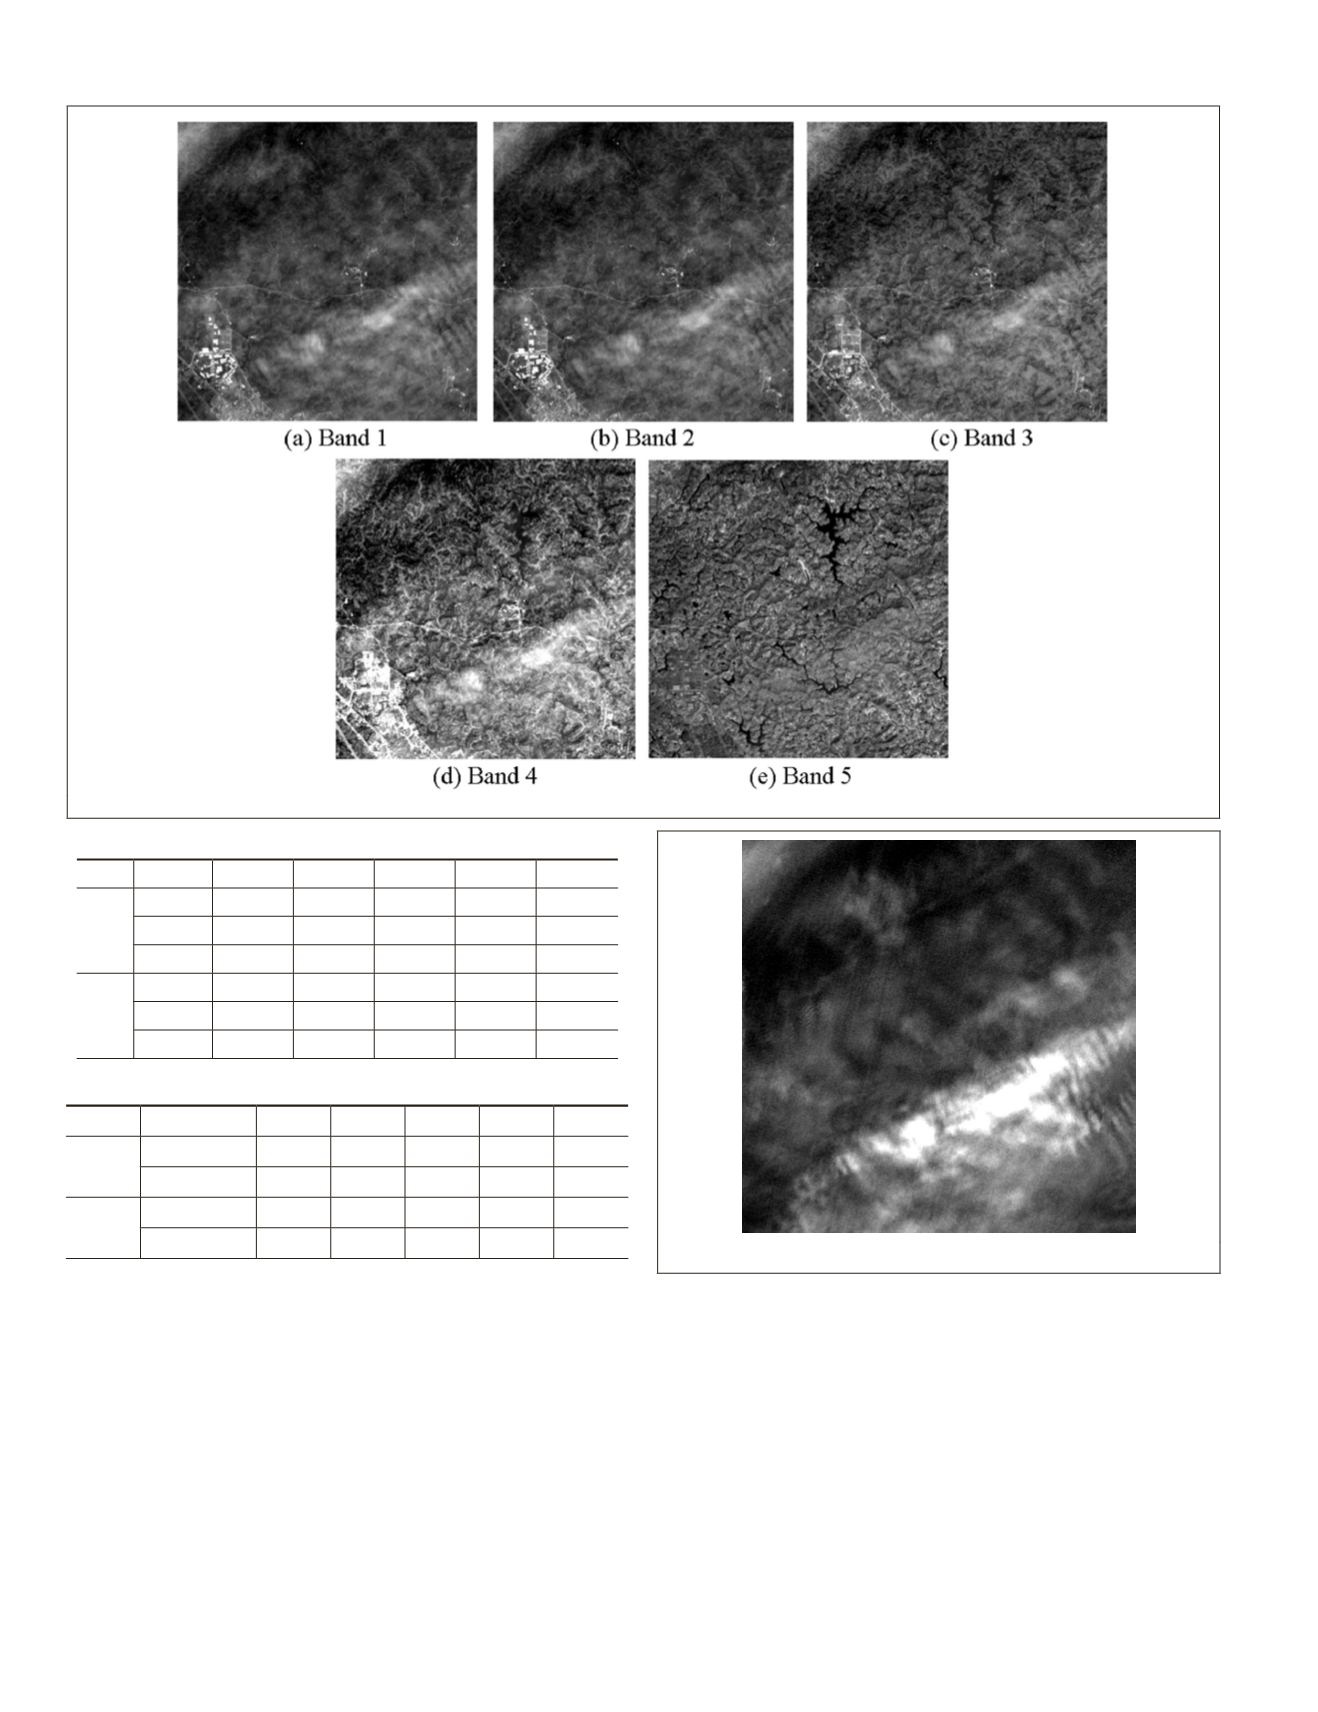
Figure 2. Reflectance values of
IMG1
.
724
September 2015
PHOTOGRAMMETRIC ENGINEERING & REMOTE SENSING


