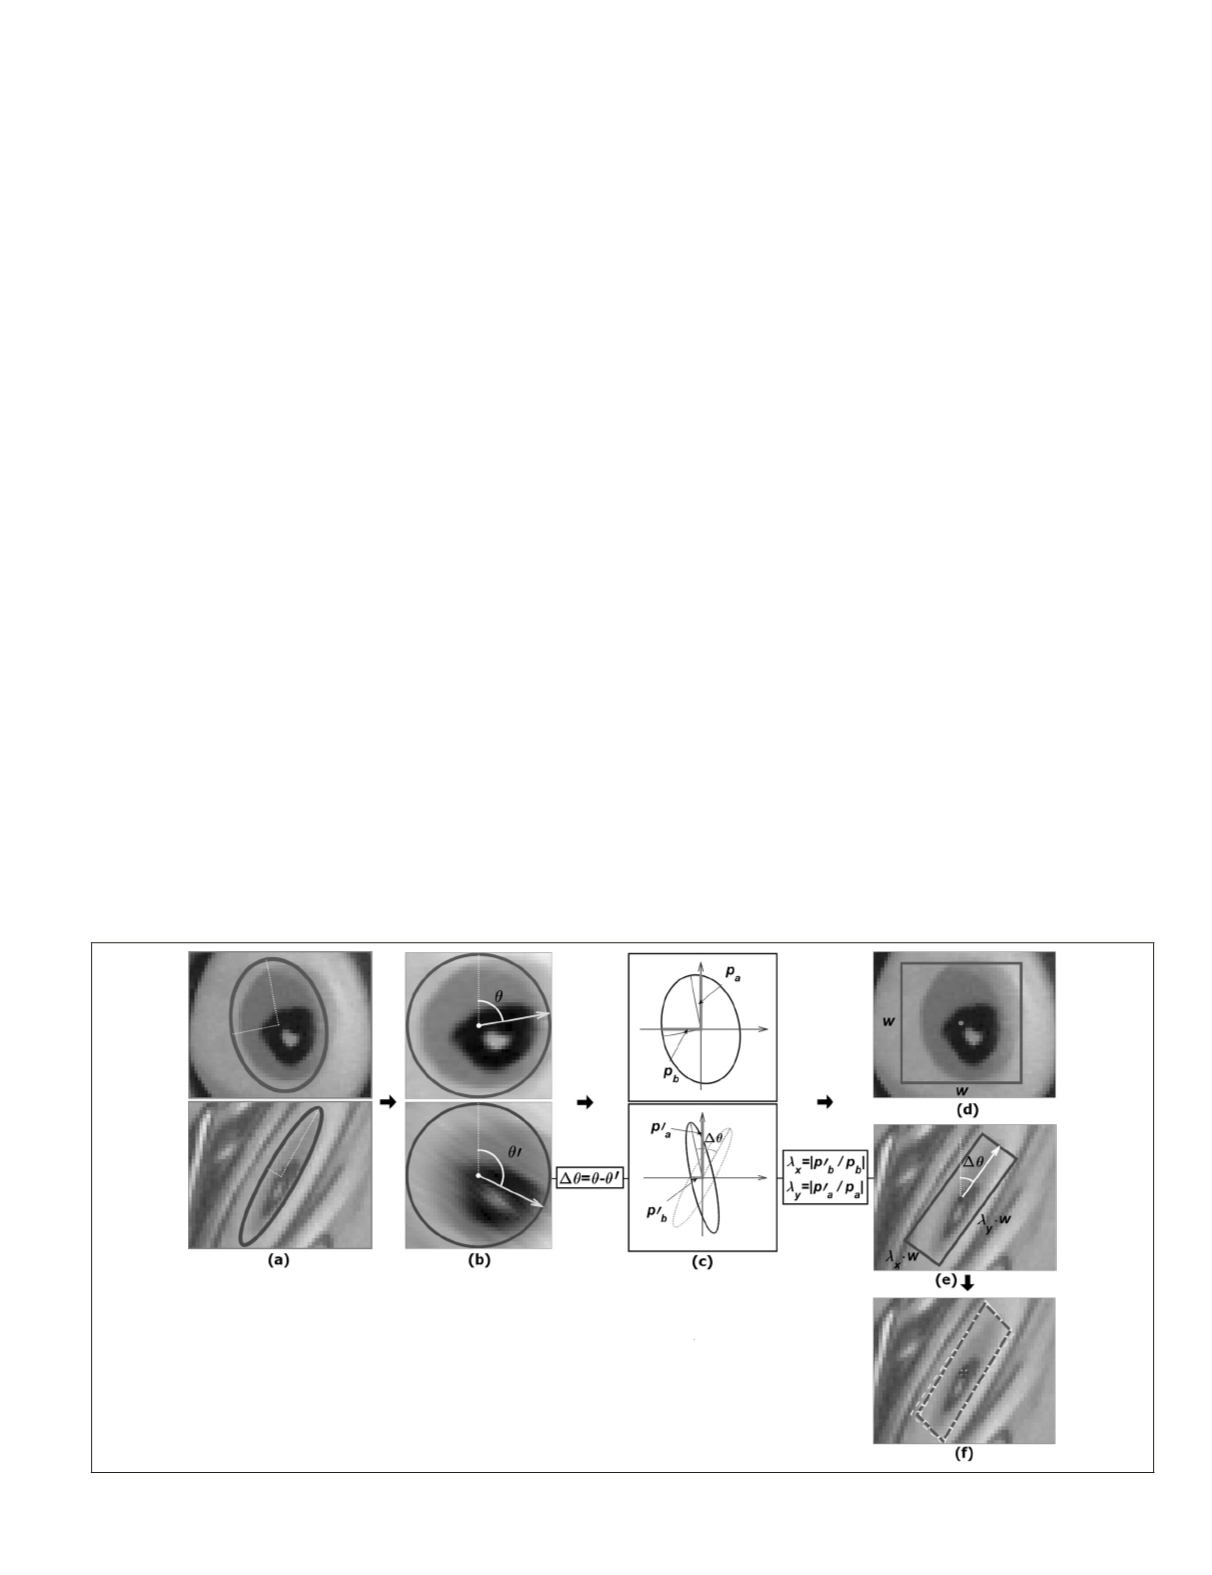
λ
x
= |
p
′
b
/
p
b
|,
λ
y
= |
p
′
a
/
p
a
|
(2)
where
p
a
,
p
b
,
p
′
a
, and
p
′
b
are the projects of the semi-major and
minor axes in the
x
and
y
directions (Figure 4c). The com-
puted dominant orientation difference (
Δ
θ
), and the estimated
scale factors (
λ
x
and
λ
y
) are considered to approximate the
matching window in the search images (Figure 4e). Finally,
the selected template in the reference image and the oriented
matching window in the search image are introduced to the
LSM
matching method, and the solution is considered as the
accurate matched feature (Figure 4f).
Because the gray level gradients are used in the
LSM
lin-
earized observation equation, the matching window should
have enough image structures (edges) for a good solution
(Luhmann
et al.
, 2006). The proposed method uses
MSER
and
Harris-Affine feature detectors that have special characteris-
tics for this constraint. The
MSER
algorithm generally extracts
the most stable locally homogeneous regions with distinctive
edge boundaries. In addition, Harris-affine algorithm extracts
salient blob-like image structures with high repeatability rate
and information content.
The size of the template window is an important factor to
be considered, however, there has been no theoretical basis
for the decision on window size (Zou
et al
., 2007). In the pro-
posed method, a constant window size is used. However, an
adaptive window based on the information content constraint
can be applied (Gruen, 1985).
The proposed
OLSM
method significantly decreases the
number of the least square iterations, because the oriented
matching window in the search image is close to the main
true position. Moreover, no additional information of the
image pair and the object is taken into account in the
OLSM
matching process.
Experimental Results
In this section, a comprehensive evaluation of the proposed
OLSM
matching method is presented. The obtained results
from the proposed method are also compared with the stan-
dard
LSM
method. In the following, image datasets, evaluation
criteria, and experimental results are presented.
Data Set
Both simulated and real data are used to evaluate the perfor-
mance of the proposed
OLSM
method. In the simulated case,
two different bands of a color, close range image or a multi-
spectral satellite image are used for simulation. One band is
considered as reference image and another band transformed
by applying a known geometric transformation as the search
image. Figure 5 shows the selected images to create the simu-
lated images. The first and the second images are close range
images, and the third and the forth images are satellite images
from SPOT5 and Worldview sensors, respectively. The input
image description is shown in Table 1. The close range images
do not have
GSD
value and location capture.
Because known geometric transformations are used to
simulate image generation, it is easy to predict the true posi-
tional accuracy of the matched features in the simulated im-
ages. Three types of transformations, including scale, rotation,
and viewpoint are used for image pair simulation. It should
be noted that to simulate an image from a different viewpoint,
the projective transformation model with different parameters
is used. As an example, the created images for various view-
point angles are shown in the Figure 6 for the first test image.
In the real data case, two image pairs comprising a close
range image pair, and a satellite image pair are used. These
real image pairs are captured under various image transforma-
tions, including rotation, scale, and viewpoint changes. The
applied real image pairs are shown in the Figure 7.
To evaluate the positional accuracy of the feature match
points, the spatial relationship between the reference and
search images should be known. To establish the spatial rela-
tionship between each image pair a projective transformation
based on manually selected control points is used. For this pur-
pose, 40~60 evenly distributed control points are manually de-
termined using an expert operator and are applied to estimate a
projective transformation. This process is iteratively performed
until an accurate projective transformation model with
RMSE
<0.25 pixels is achieved. Close range images are taken from a
planar scene, and the satellite images are medium resolution
images, so that the images can be accurately related by 2
D
pro-
jective transformations. This estimated projective model is used
to evaluate the quality of the proposed matching method.
Figure 4. Proposed
olsm
method process: (a) an initial matched feature pairs detected with
mser
algorithm, (b) normalized regions and their dominant orientations, (c) scale factors computation
based on the comparison of the projection of the semi axes of two matched ellipses, (d) template
window in the reference image, (e) matching window approximation, and (f)
olsm
result.
PHOTOGRAMMETRIC ENGINEERING & REMOTE SENSING
September 2015
737


