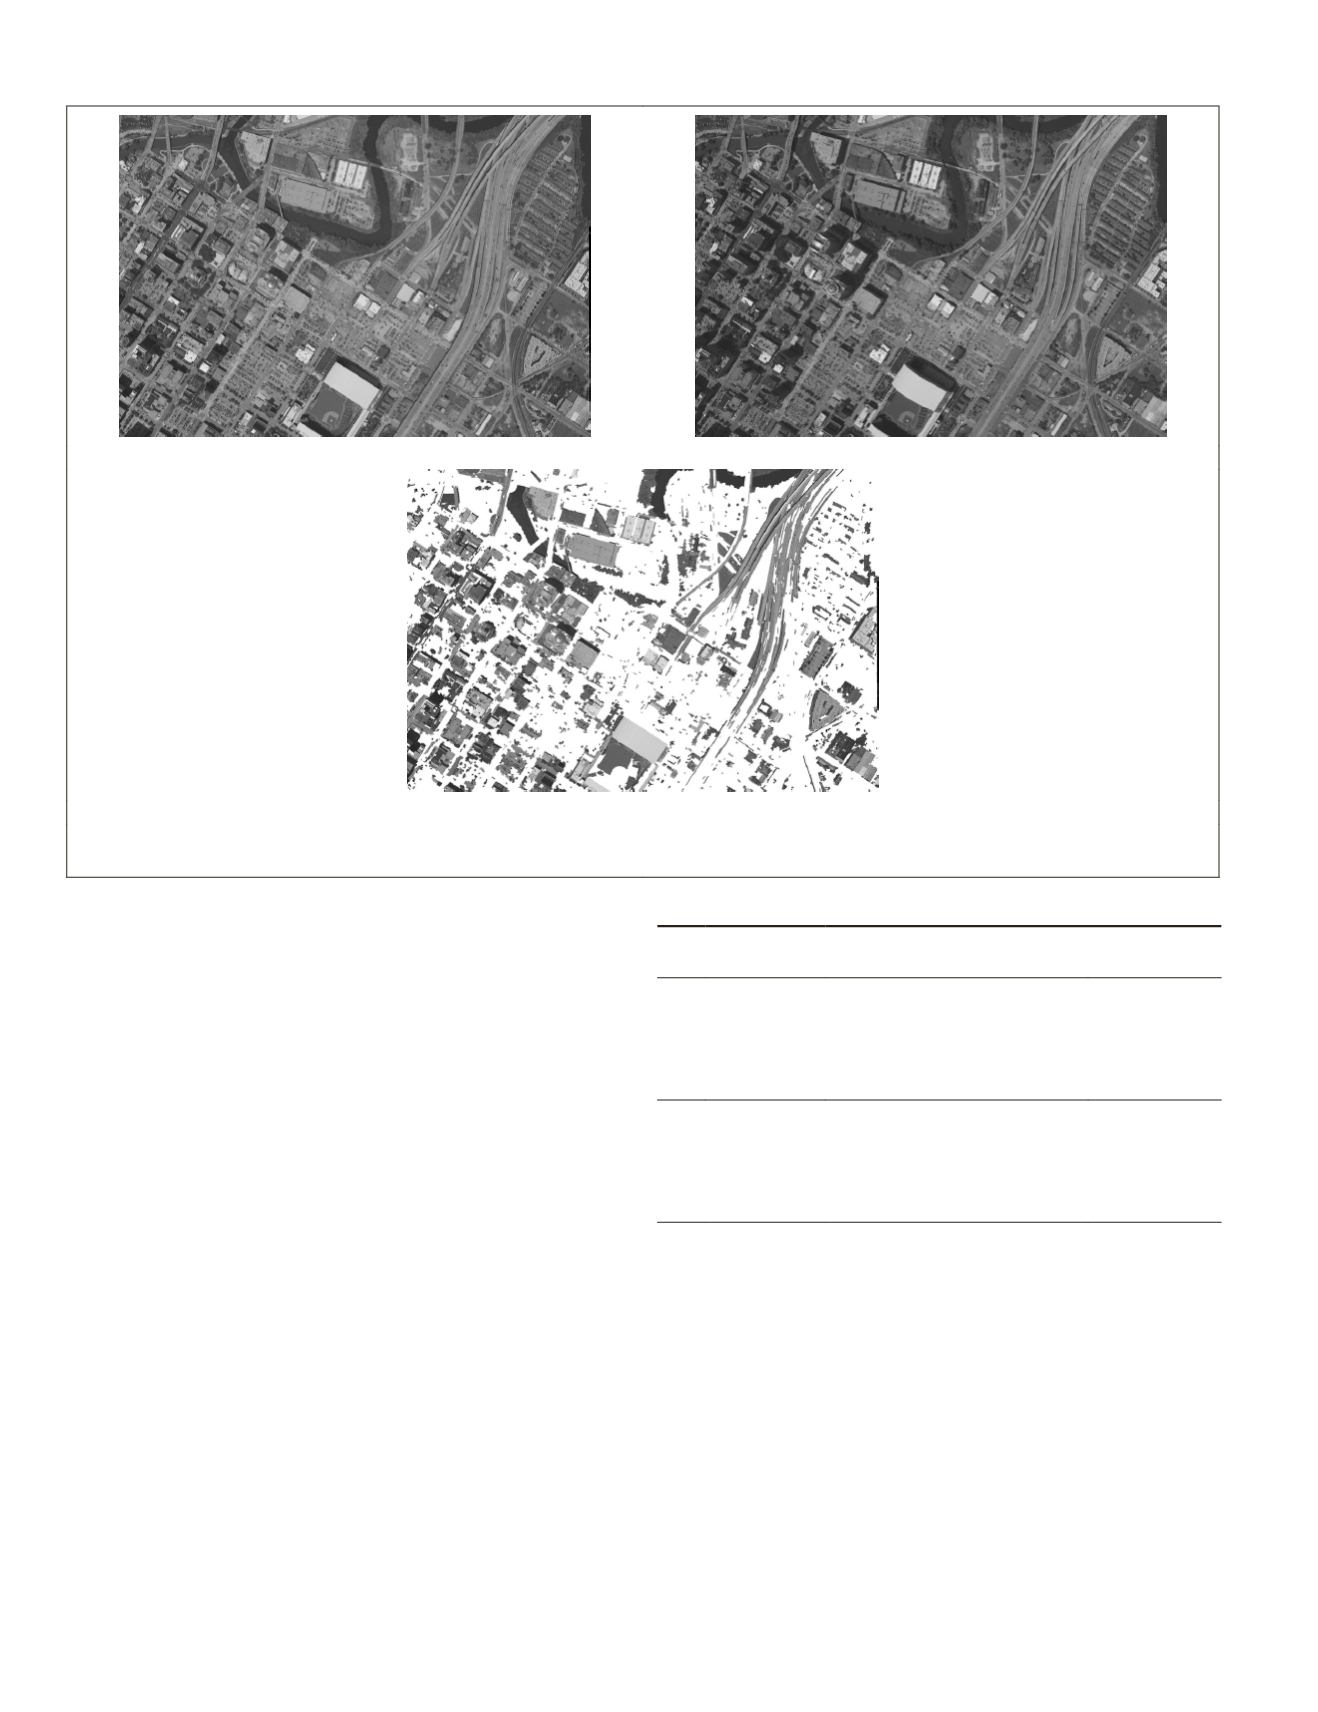
(a)
(b)
(c)
Figure 3. POAs determination for Data Set 1: (a) the overlapping area of left image, (b) the overlapping area of right image, and (c) POAs
(white areas) overlaid on the overlapping area of the left image.
methods without feathering are demonstrated in Figure 5 and
Figure 9. In order to achieve high-quality image mosaick-
ing results, the feathering is applied along the seamlines to
achieve a seamless mosaic (Kerschner, 2001; Pan
et al.
, 2009;
Wan
et al.
, 2012; Wang
et al.
, 2012; Wan
et al.
, 2013; Pan
et
al.
, 2014a), but this paper focuses on the automatic seamline
determination. In order to show possible visual discontinui-
ties appeared in the mosaicked images using different seam-
line determination methods, the final resultant mosaicked
images are mosaicked using different seamline determination
methods without feathering (Pan
et al.
, 2014b). Figure 6 and
Figure 10 further show the selected regions in Figure 5 and
Figure 9 without feathering, using different seamline determi-
nation methods. To compare the final resultant mosaicked im-
ages using different seamline determination methods directly,
the same selected regions are considered for the previous
methods and the proposed method. In order to show visual
discontinuities, we added marked ellipse to show the visual
discontinuities appeared in the mosaicked images in the Fig-
ure 6 and Figure 10. They show that visual discontinuities ap-
pear in the mosaicked images using the other three methods.
In many related studies, seamline quality is not gener-
ally evaluated through accuracy assessment (Chen
et al.
,
2014). Therefore, similar to the evaluation method in other
relevant studies (Ma and Sun, 2011; Pan
et al.
, 2014b; Chen
et al.
, 2014), the quantitative index applied in the proposed
method is the number of times that seamlines pass through
obvious objects. To evaluate the performance of the different
methods fairly, all of the four methods were tested in a single
thread. The processing time for seamline determination was
recorded for comparison. A quantitative comparison of Data
Set 1 and Data Set 2 was made as shown in Table 1. It can be
seen that the seamlines determined by Dijkstra’s algorithm
passed through five bridges in Data Set 1 and six buildings in
Data Set 2. Chon’s method was much better, but the seam-
lines went across one bridge and two buildings in Data Set
1 and twenty-two buildings in Data Set 2, and used the most
processing time. Pan’s method had a good result in Data Set
1, but it went across three buildings in Data Sets 2. Although
Pan’s method used the image pyramid to improve the effi-
ciency, it still used more processing time than the proposed
method. The seamlines determined by the proposed method
passed through one bridge in Data Set 1, which is shown in
Figure 4(b), and no obvious objects in Data Set 2. By com-
parison, our method obtained the best outcome and bypassed
most obvious objects successfully. By using regional adaptive
marker-based watershed segmentation and Dijkstra’s shortest-
path searching algorithm with a binary min-heap, the run
T
able
1. C
omparison
of
P
revious
M
ethods with
the
P
roposed
M
ethod
Data
set
Method
Number of obvious objects
passed through
Processing
time(s)
1
Dijkstra’s
5 bridges
349.160
Chon’s
1 bridge and 2 building
13766.832
Pan’s
none
166.578
Proposed
1 bridge
12.012
2
Dijkstra’s
6 building
1173.606
Chon’s
22 building
91566.173
Pan’s
3 building
176.202
Proposed
none
36.551
126
February 2016
PHOTOGRAMMETRIC ENGINEERING & REMOTE SENSING


