time of the proposed method takes 12.012 sec and 36.551 sec
for Data Set 1 and 2, respectively.
It is suggested that a value of
T
in the range between 0.6
and 0.7 be chosen (Li
et al.
, 2010). In our experiment,
T
was
set to 0.65 and
A
was set to 15 in Figure 3 to Figure 10. Here,
we set
T
to 0.6, 0.65, and 0.7, while setting
A
to 15, for the
segmentation of the overlapping area and compare the results.
The three seamlines with different values of
T
for the two
Data Sets are almost the same. This experiment demonstrates
that the proposed algorithm is robust and is not sensitive to
the segmentation parameter
T
in the range between 0.6 and
0.7 for the two Data Sets.
However, it should be noted that the effect of the proposed
method is determined by the result of the segmentation. There
are two tunable parameters in the segmentation method: the
area
A
of the smallest discernible object and the scale factor
T
for the marker extraction. The area threshold
A
can be set as
the area of smallest discernible object on the image, but there
is still no automatic solution to selecting the scale factor
T
at
present. In actual production, what we did was to choose cer-
tain typical images and test which parameters would produce
suitable segmentation results. Then, the selected parameters
were applied to other images for seamline determination in
mosaicking. The change of parameter
T
induces different
marker extraction results for different types of objects. For
the textured objects, the lower the value of
T
is, the less the
object inner pixels are marked and the more the markers are
extracted, which leads to their over-segmentation, and vice
versa; however, for the homogenous objects, the lower the
value
T
is, the more the object inner pixels are marked and the
less the markers are extracted, which may lead to their under-
segmentation, and vice versa (Li
et al.
, 2010). Figure 11 shows
seamlines determined in the proposed method of Data Set 1
with different values of
T,
where
A
is set to 15. A quantitative
comparison of seamlines determined by the proposed method
for Data Set 1 with different values of
T
is made as shown
in Table 2. Although Li
et al.
(2010) suggested setting
T
to a
value in the range between 0.6 and 0.7 in the regional adap-
tive marker-based watershed segmentation, it can be seen that
the seamlines determined results in the proposed method are
much different for different values of
T
. According to Table 2,
an acceptable seamlines determination result is obtained by
setting
T
to 0.5 for Data Set 1. It is suggested that a value of
T
in
the range between 0 and 1 be chosen in the proposed method.
Conclusions
In this paper, we proposed a novel method for seamline de-
termination based on marker-based watershed segmentation.
The segmentation is used to improve the seamline determi-
nation. It determines the optimal seamlines at two different
(a)
(b)
(c)
(d)
(e)
(f)
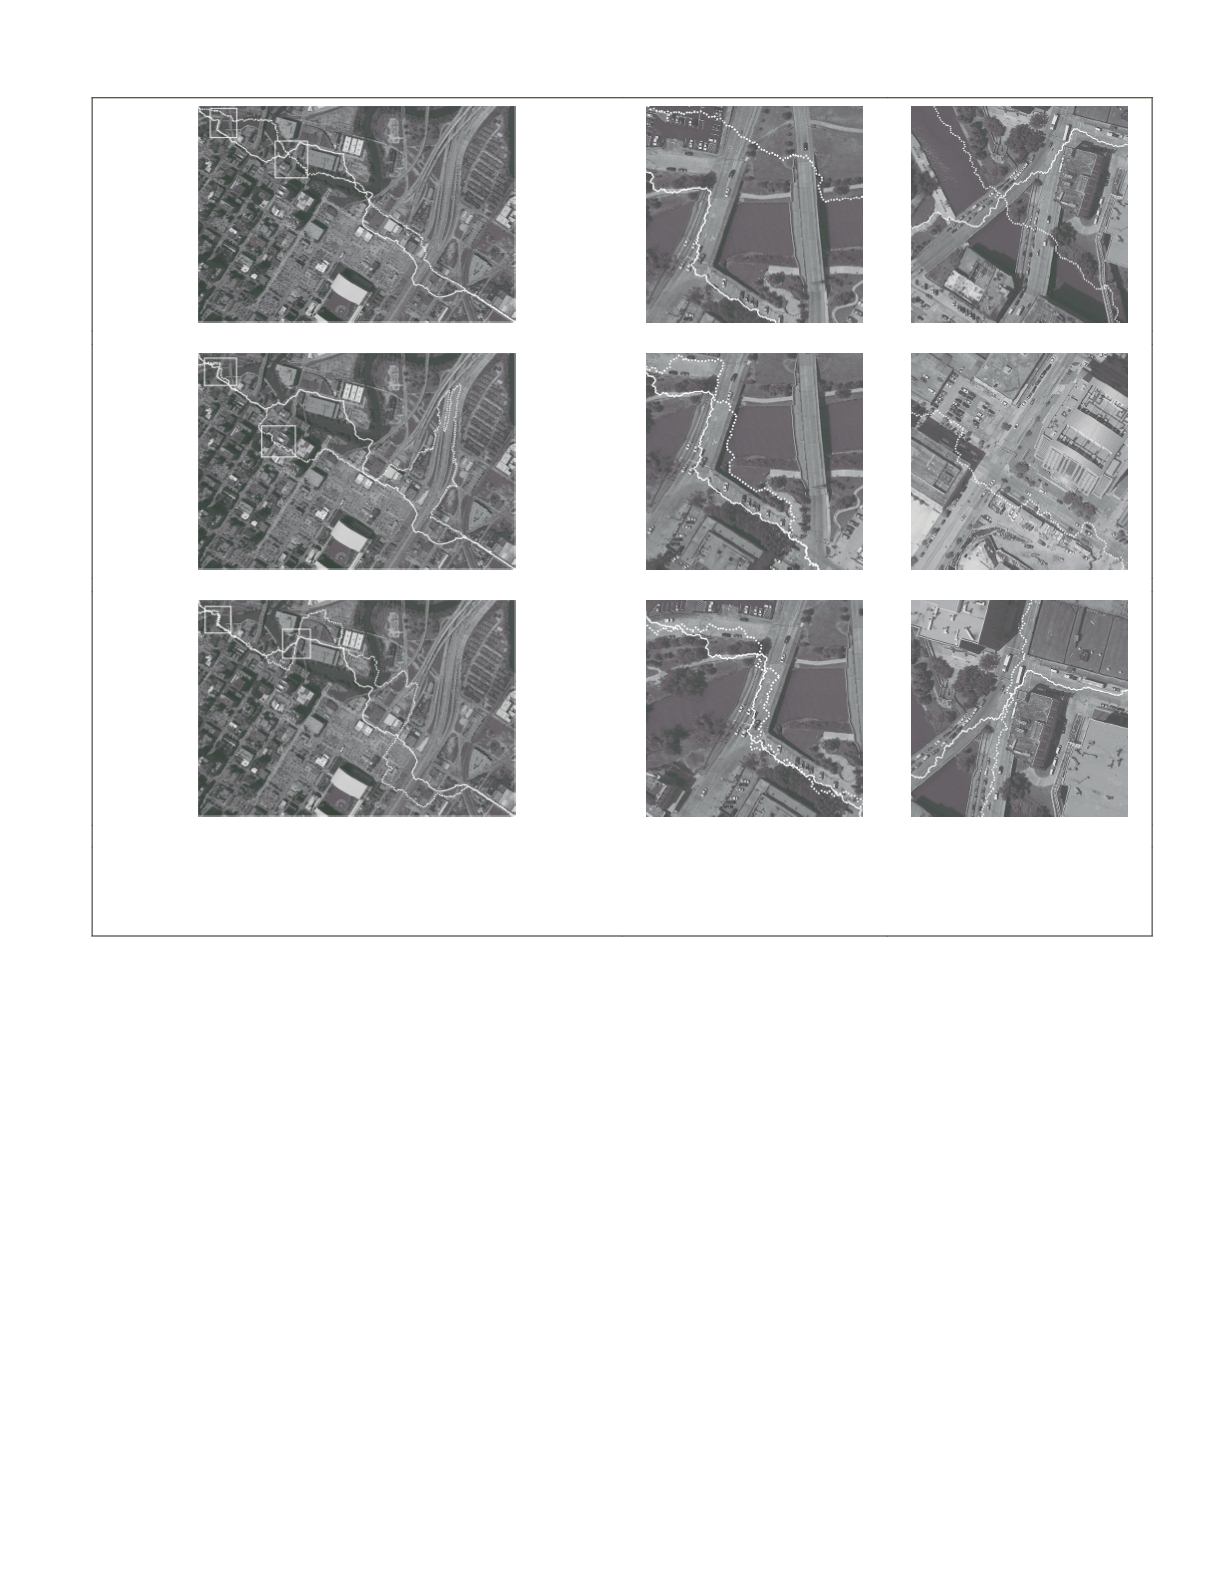
Figure 4. Seamline determination for Data Set 1: (a) seamlines determined by Dijkstra’s algorithm (dotted line) and the proposed method
(solid line), (b) details of marked rectangles in (a), (c) seamlines determined by Chon’s method (dotted line) and the proposed method
(solid line), (d) details of marked rectangles in (c), (e) seamlines determined by Pan’s method (dotted line) and the proposed method
(solid line), (f) details of marked rectangles in (e).
PHOTOGRAMMETRIC ENGINEERING & REMOTE SENSING
February 2016
127


