(a1)
(a2)
(b1)
(b2)
(c1)
(c2)
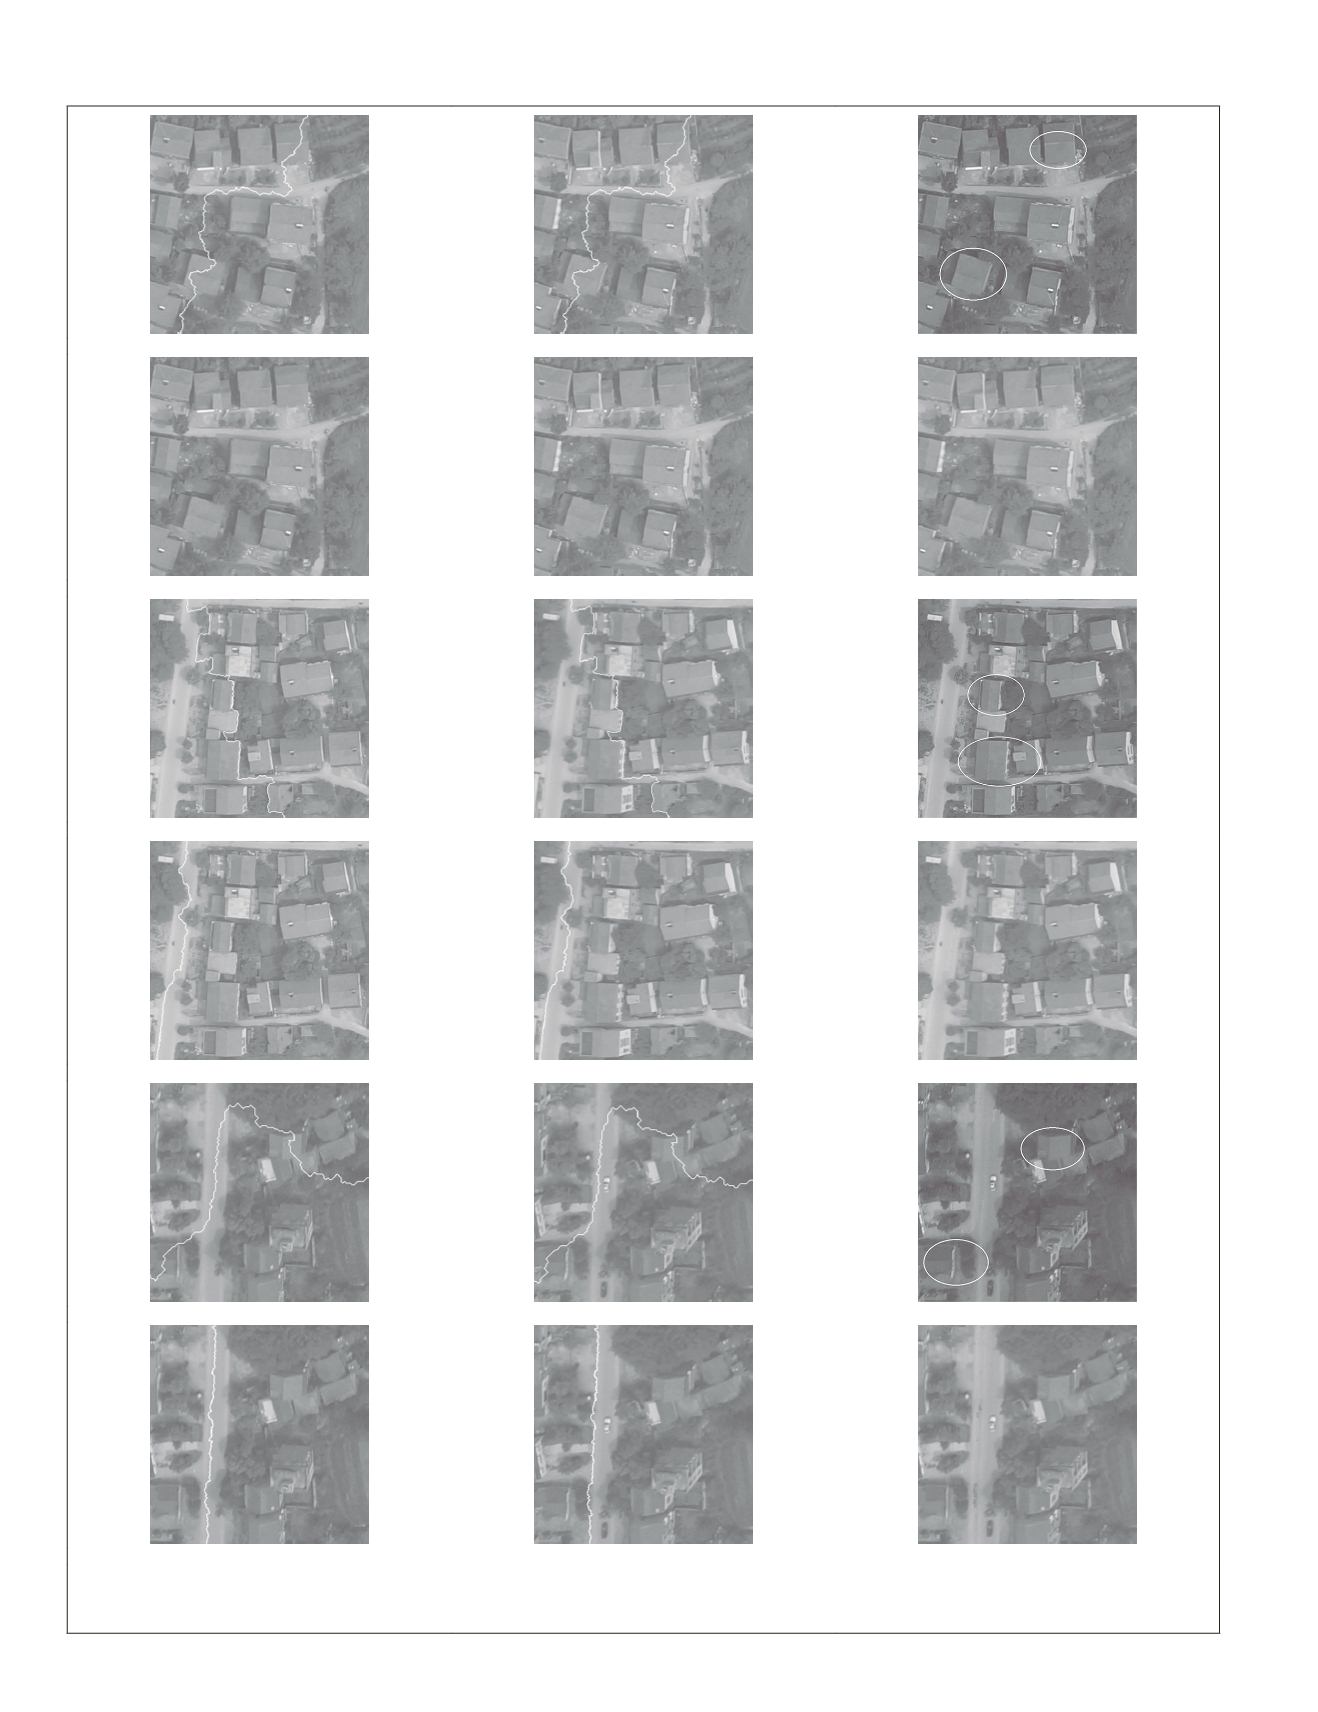
Figure 10. Selected regions of (from left to right) left image with seamline (solid line), right image with seamline (solid line) and mo-
saicked image for Data Set 2: (a1) Dijkstra’s algorithm, (a2) the proposed method, (b1) Chon’s method, (b2) the proposed method, (c1)
Pan’s method, (c2) the proposed method.
132
February 2016
PHOTOGRAMMETRIC ENGINEERING & REMOTE SENSING


