(a)
(b)
(c)
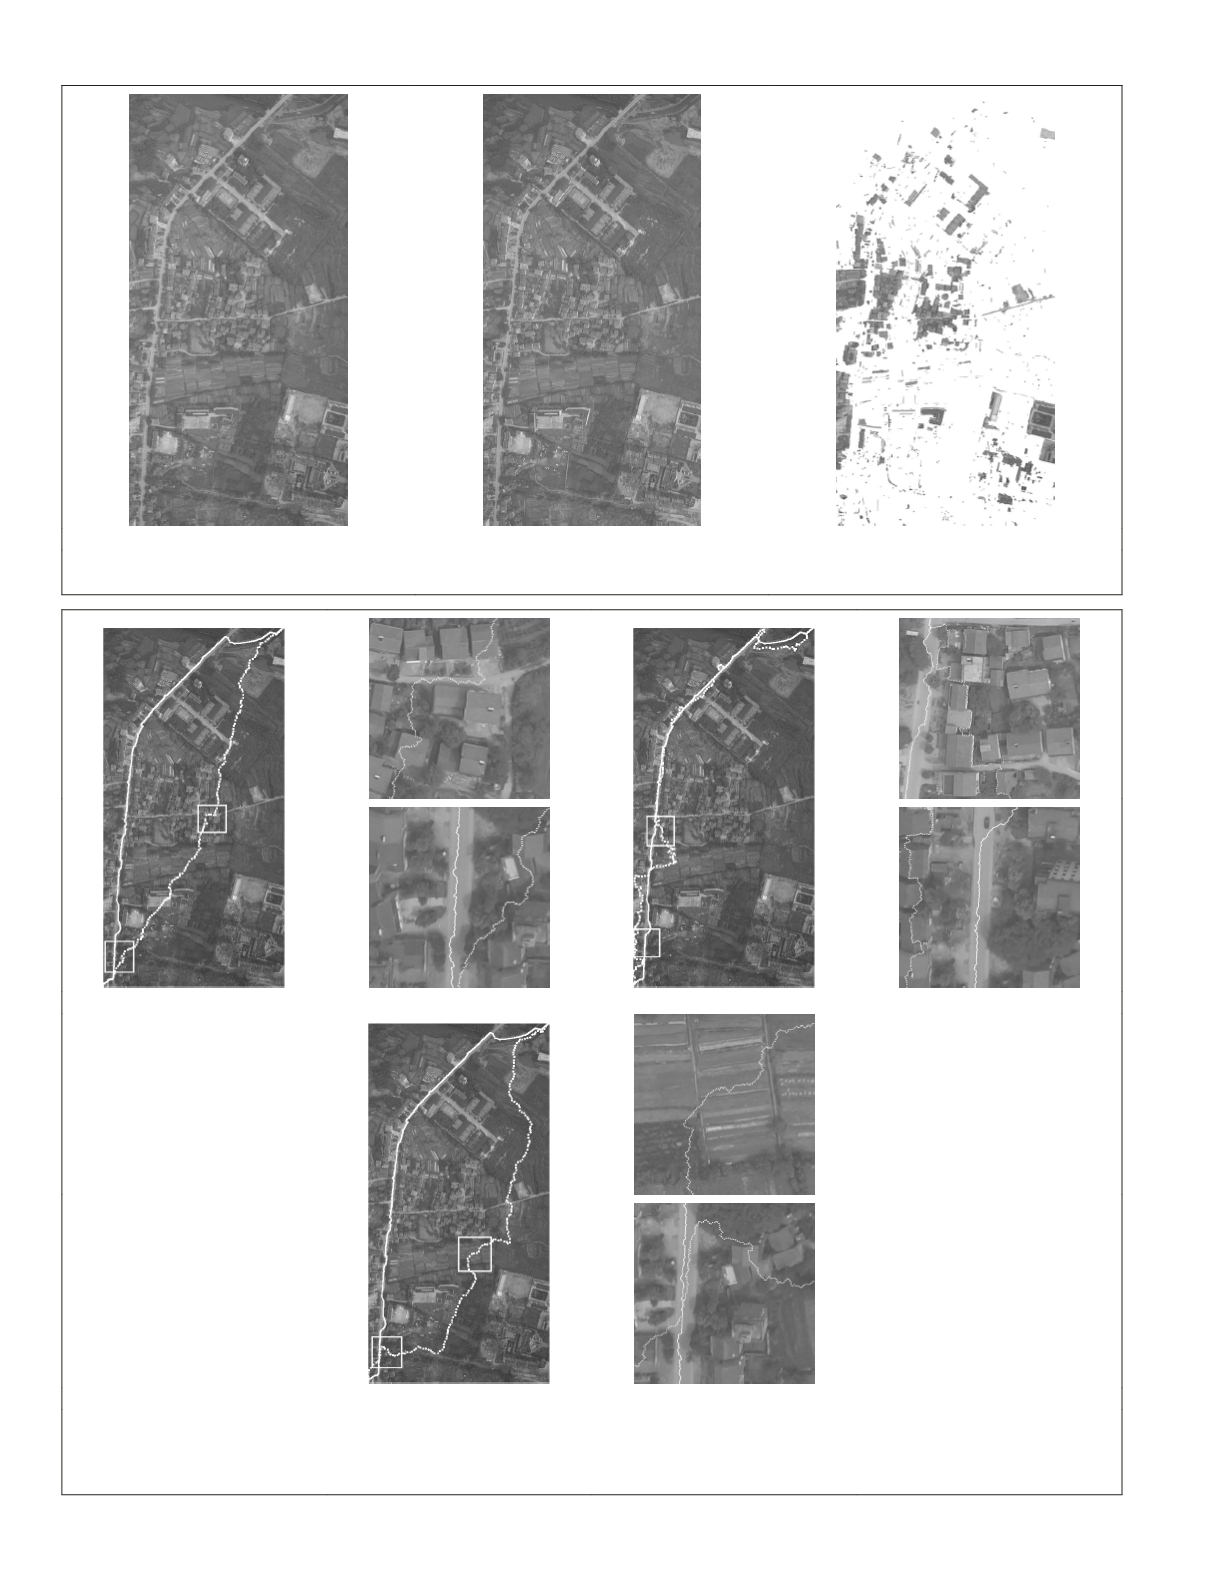
Figure 7. POAs determination for Data Set 2: (a) the overlapping area of left image, (b) the overlapping area of right image, and (c) POAs
(white areas) overlaid on the overlapping area of left image.
(a)
(b)
(c)
(d)
(e)
(f)
Figure 8. Seamline determination for Data Set 2: (a) seamlines determined by Dijkstra’s algorithm (dotted line) and the proposed method
(solid line), (b) details of marked rectangles in (a) and (c) seamlines determined by Chon’s method (dotted line) and the proposed method
(solid line), (d) details of marked rectangles in (c) , (e) seamlines determined by Pan’s method (dotted line) and the proposed method
(solid line), (f) details of marked rectangles in (e).
130
February 2016
PHOTOGRAMMETRIC ENGINEERING & REMOTE SENSING


