(a)
(b)
(c)
(d)
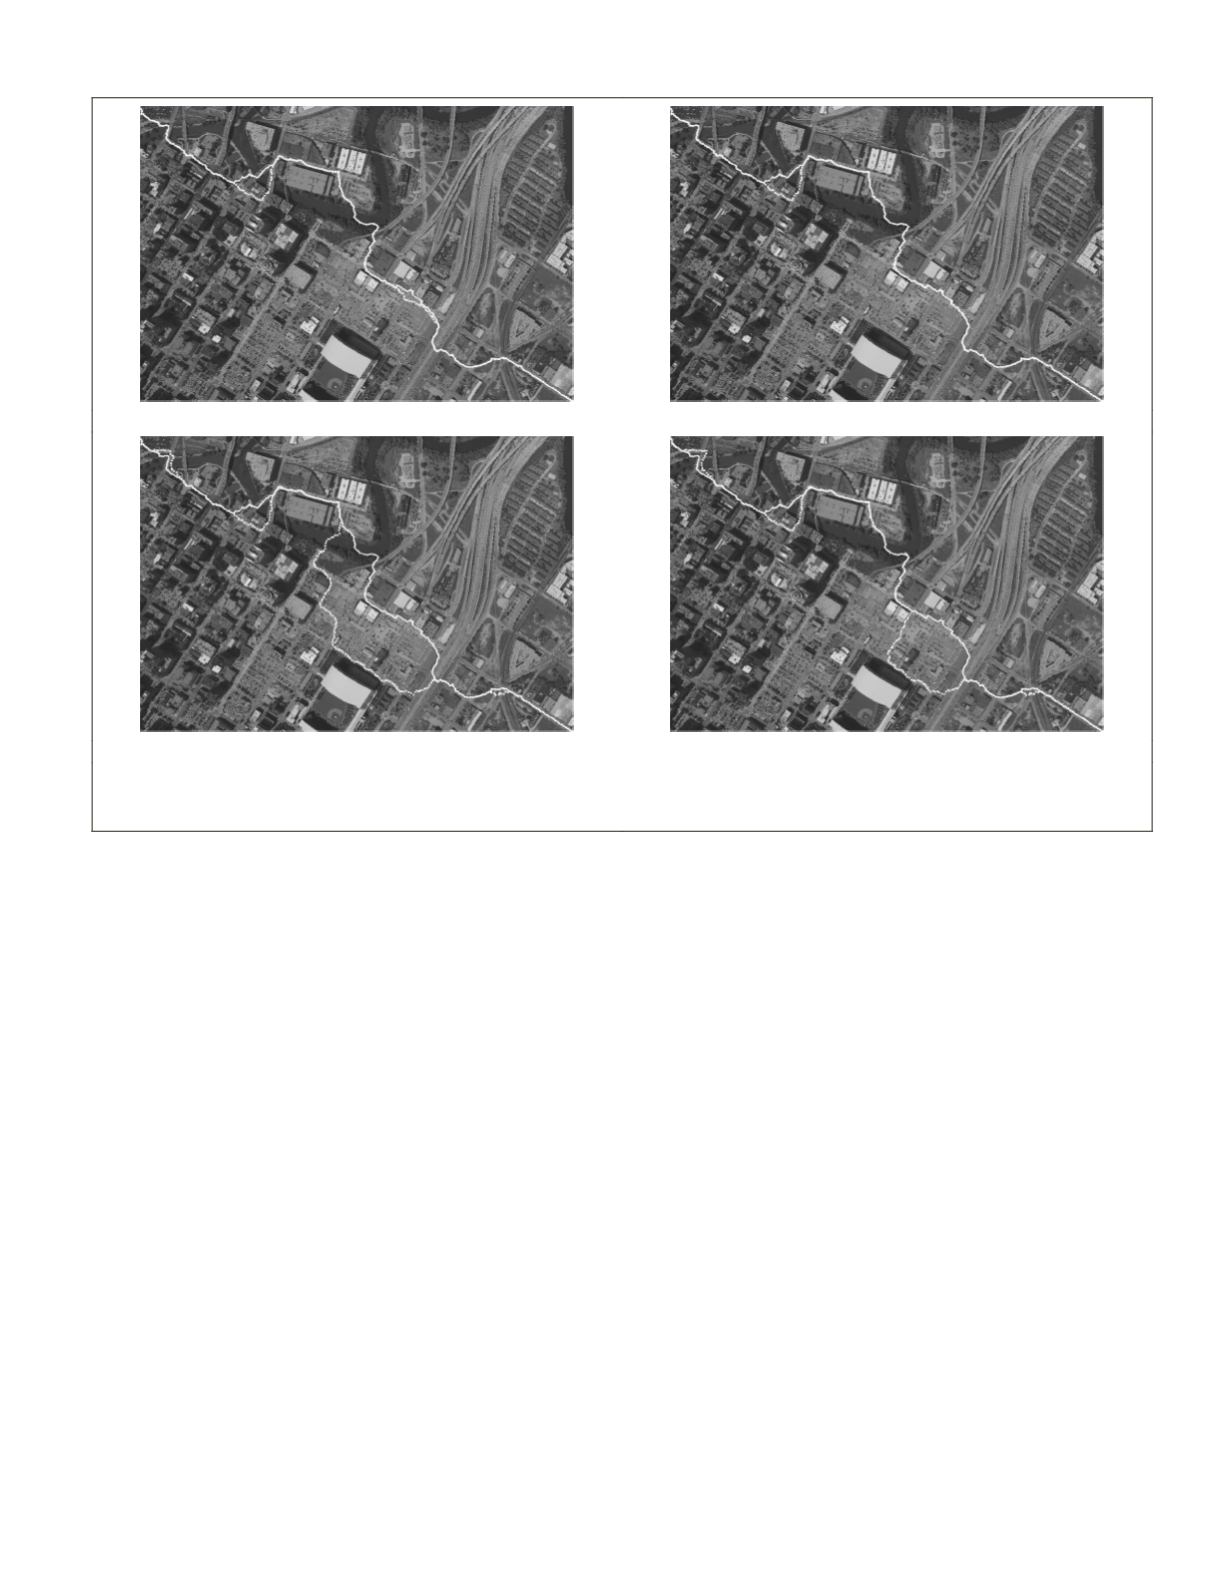
Figure 11. Seamlines determined by the proposed method for Data Set 1 with different values of
T
: (a)
T
is 0.65 (solid line) and
T
is 0.4
(dotted line), (b)
T
is 0.65 (solid line) and
T
is 0.5 (dotted line), (c)
T
is 0.65 (solid line) and
T
is 0.8 (dotted line), and (d)
T
is 0.65 (solid
line) and
T
is 0.9 (dotted line).
PHOTOGRAMMETRIC ENGINEERING & REMOTE SENSING
February 2016
133


