types are taken into consideration for each state. These eight
feature sets are clustered with three clustering algorithms in-
cluding K-means,
FCM
, and
ISODATA
. With combination of eight
feature sets and three clustering algorithm, 24 models are built
for image segmentation. The results of the image segmentation
by using these 24 models are compared based on some defined
metrics, and finally one model is selected appropriate model.
For this purpose, some metrics need for model evaluation.
The following metrics are used for quantitative comparison
of the results for segmentation:
1. F index was proposed first by Liu and Yang (1994), and
it was used for unsupervised segmentation evaluation
by Hui Zhang
et al
. (2008) that measures the average
squared error of the segments, penalizing the over-seg-
mentation by weighting proportional to the square root
of the number of segments. It requires no user-defined
parameters and is independent of the contents and the
type of image. This factor is formulated as Equation 6
where,
N
is the total number of regions in an image,
n
i
is the number of pattern in region
R
i
,
C(p)
is the gray
level of pixel
p
, and
C
ˆ is the average of gray level of
pixels in region
R
i
(Hui Zhang
et al.,
2008).
F N
C p C R
n
i
N
p R
i
i
i
=
( )
−
( )
(
)
=
∈
∑
∑
1
2
ˆ
(6)
2.
β
index was used widely for clustering evaluation in
the literature (e.g., Mitra
et al.
, 2004; Hui Zhang
et al.
,
2008) that the quantitative cluster quality index that is
defined as Equation 7, where
μ
i
is the mean of patterns
in the
i
th
cluster, and
μ
is the mean value of the entire
set of patterns.
(
)
(
)
β
µ
µ
µ
µ
=
( )
−
( )
−
(
)
( )
−
( )
−
=
∈
=
∈
∑ ∑
∑ ∑
i
N
p R
T
i
N
p R
i
T
i
i
i
C p
C p
C p
C p
1
1
(
)
(7)
This measure is the ratio of the total variation and
within-cluster variation.
4.
β
/
F
metric was proposed in this paper for better com-
parison that is a combination of two above metrics.
High value for
β
/
F
represents the better efficiency.
To model selection, the
β
index is used; this measure mini-
mizes the inter-cluster distances and maximizes the intra-clus-
ter distances. Using three clustering methods (i.e., K-means,
FCM
, and
ISODATA
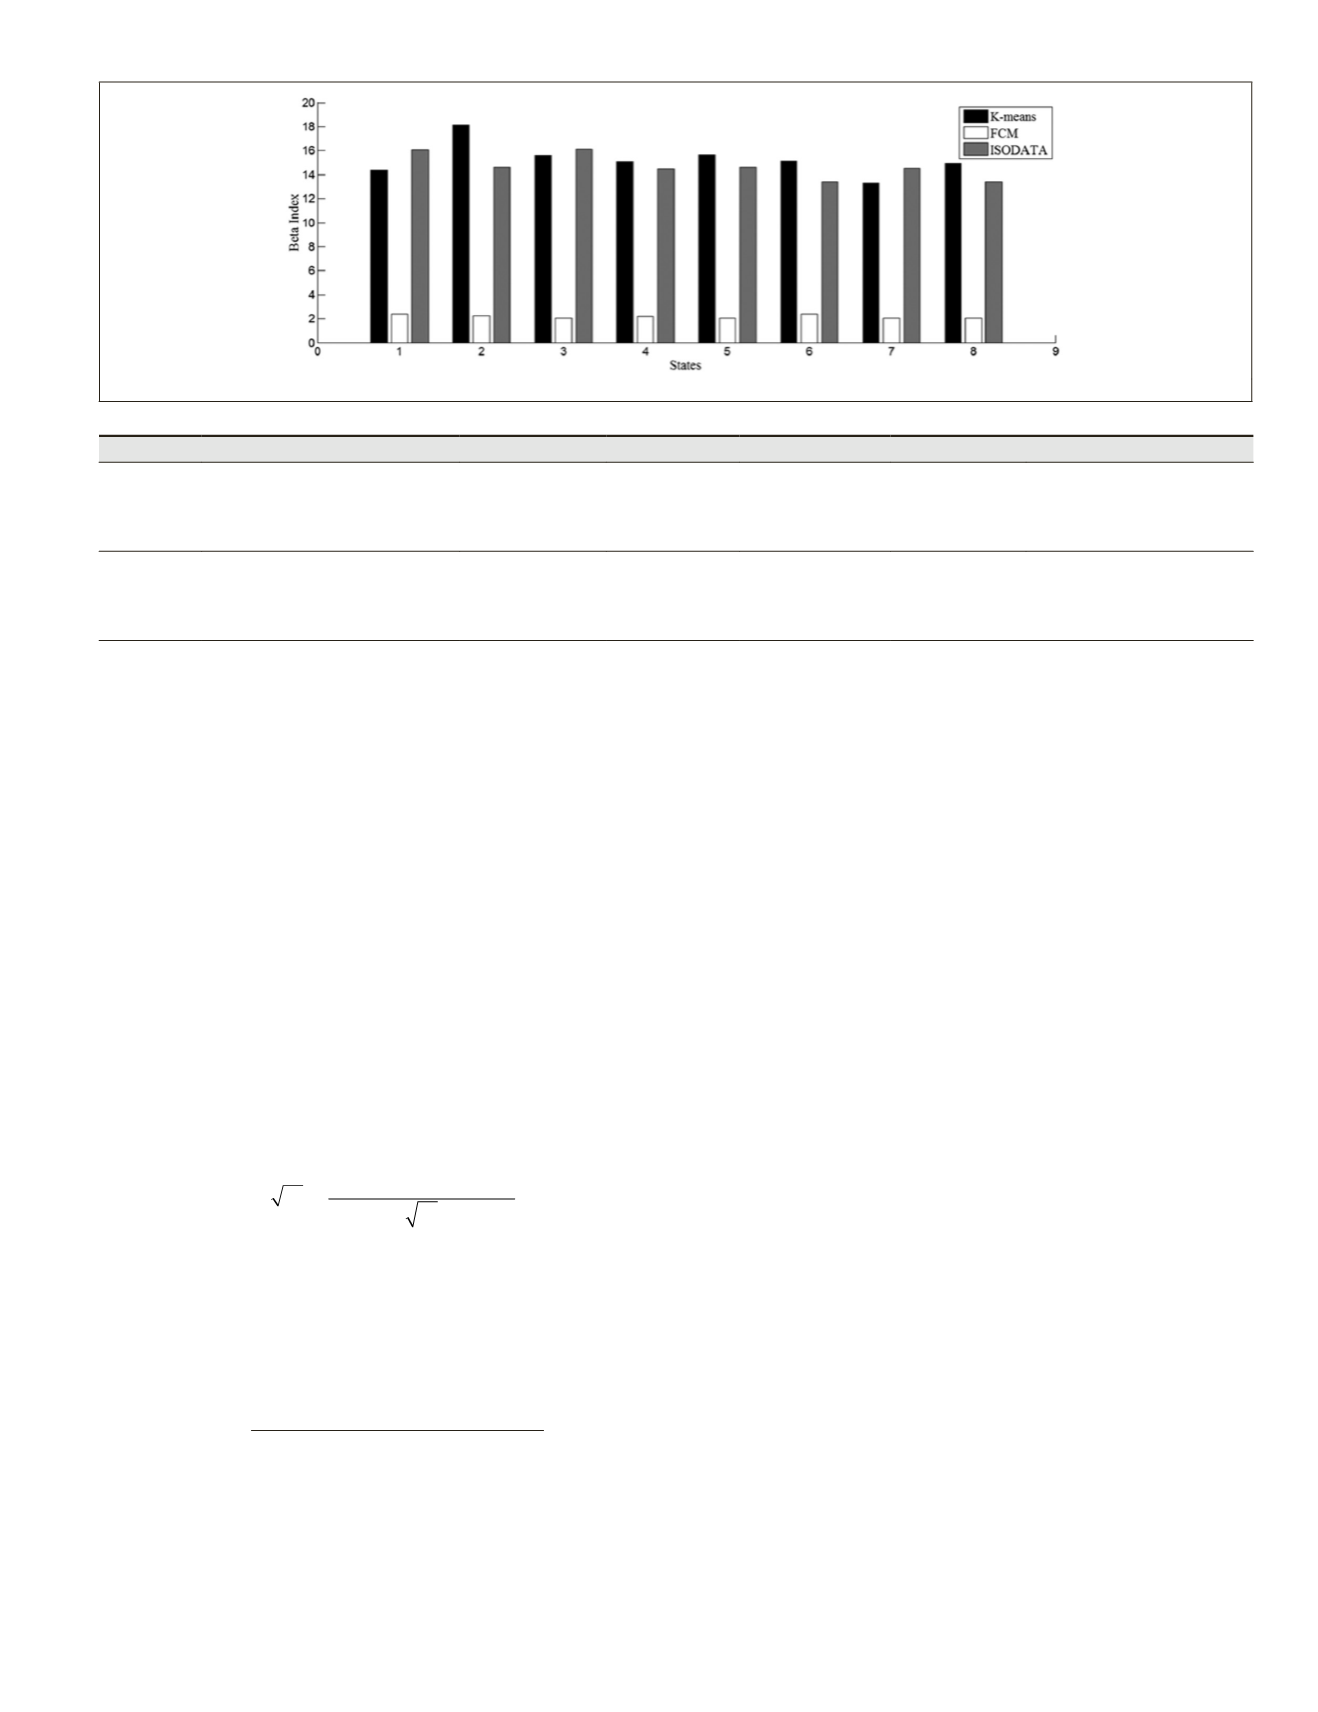
) and eight feature sets yield 24 models that
their
β
values are shown in Figure 4. As seen in this figure,
β
is
maximum value when K-means clustering algorithm along with
feature set 2 is used. Hence, this model has been used as an ap-
propriate model in our experiments for segmentation of
VHRSI
which have same spatial resolution and land cover classes.
Performance Evaluation
Case Study
The efficiency of the proposed method is evaluated on two
examined datasets captured by QuickBird and GeoEye satel-
lites. Table 5 summarizes the specifications of examined
datasets. The main purpose of selecting two satellite images
from different areas with the same land cover is to evaluate
the potential of the proposed
FS
method for general cases. In
the other words, an ideal
FS
method for segmentation should
be capable to be used for other datasets with almost the same
spatial resolution. In this regards, the
FS
step which is a time
consuming task in segmentation of
VHRSI
is only applied to
the labeled image, and it is not necessary for test images.
Subsets of images from QuickBird and GeoEye satellites
with same classes (in number of classes and type) along with
variety of land occupation in each subset were picked. Di-
mension of panchromatic subsets are 1,000 × 1,000 pixels and
corresponding multispectral images with 250 × 250 pixels.
Seven datasets of these subsets are shown in Figure 5 and
Figure 6 (identified as DS1, DS2… DS7). From these datasets,
only DS1 is selected for labeled and the others are used to test
the generalization ability of the
FS
methods.
Parameter Initialization
All features are generated with three masks including 3 × 3, 5 ×
5, and 7 × 7. The generated features by
GLCM
are calculated with
three levels of quantization and one distance offset. Directional
features are generated in four directions including 0, 45, 90, and
135 degrees. The frequency of Gabor features are tuned to 0.5.
Five initial clusters are considered for K-means and
FCM
based on the number of land cover classes. The parameters
of
ISODATA
clustering include: the number of initial pixels
(set to 7), the minimum number of clusters (set to 5), and the
Figure 4. The
β
of three clustering methods using eight feature sets (i.e., 24 models).
T
able
5. D
atasets
S
pecifications
(D
igital
G
lobe
, 2014)
Satellite
Position & Time
Pan resolution MS resolution Band number
Band Name Wavelength Range, nm
QuickBird
Gerash, Fars Province, Iran
28° 47' 54" N
52° 48' 13" E
10 Jun 2010
65 cm
405–1053 nm
260 cm
1
2
3
4
Blue
Green
Red
NIR
430-545
466-620
590-710
715-918
GeoEye
Amirsalar, Fars Province, Iran
27° 39' 55" N
54° 08' 14" E
18 Nov 2010
41 cm
450–800 nm
165 cm
1
2
3
4
Blue
Green
Red
NIR
450-510
510-580
655-690
780-920
PHOTOGRAMMETRIC ENGINEERING & REMOTE SENSING
March 2016
217


