“
max
a
” are the minimum and maximum values of feature “
a
”.
Min-max normalization maps a value
v’
in the range (0, 1)
(Visalakshi and Thangavel, 2009).
v
′
=
v min
max min
a
a
a
−
−
(
)
(5)
Step 1: Independent pair direction selection
Here, the problem is selection of suitable pair direction
among six states (i.e., (0, 45), (0, 90), (0,135), (45, 90), (45,135),
and (90,135)) in both directional features. Two unsupervised
criteria are used to solve this problem including correla-
tion coefficient (J1) and maximum information compression
index (J2) (Mitra
et al.,
2002). High distance between features
corresponds to low dependency between them and also low
correlation coefficient (J1) and consequently high compres-
sion information (J2). Based on these two criteria, the features
that have lower J1 or higher J2 between these six states are
selected as lower dependency features. As shown in Table 2,
both criteria provide same decision for direction selection for
all features. At the end, the suitable pair directions with lower
dependency are selected for all directional features.
Step 2: Informative Direction Selection
In this step, an informative direction between pair selected
directions (obtained in Step 1) is selected by using two
criteria. Indeed, the effect of each feature in class separation
is investigated. For this purpose, “Bhattacharyya distance”
(Bhattacharyya, 1943) and “scatter matrix” are used that scat-
ter matrix minimizes the inter-class distances and maximizes
the intra-class distances (Battiti, 1994).
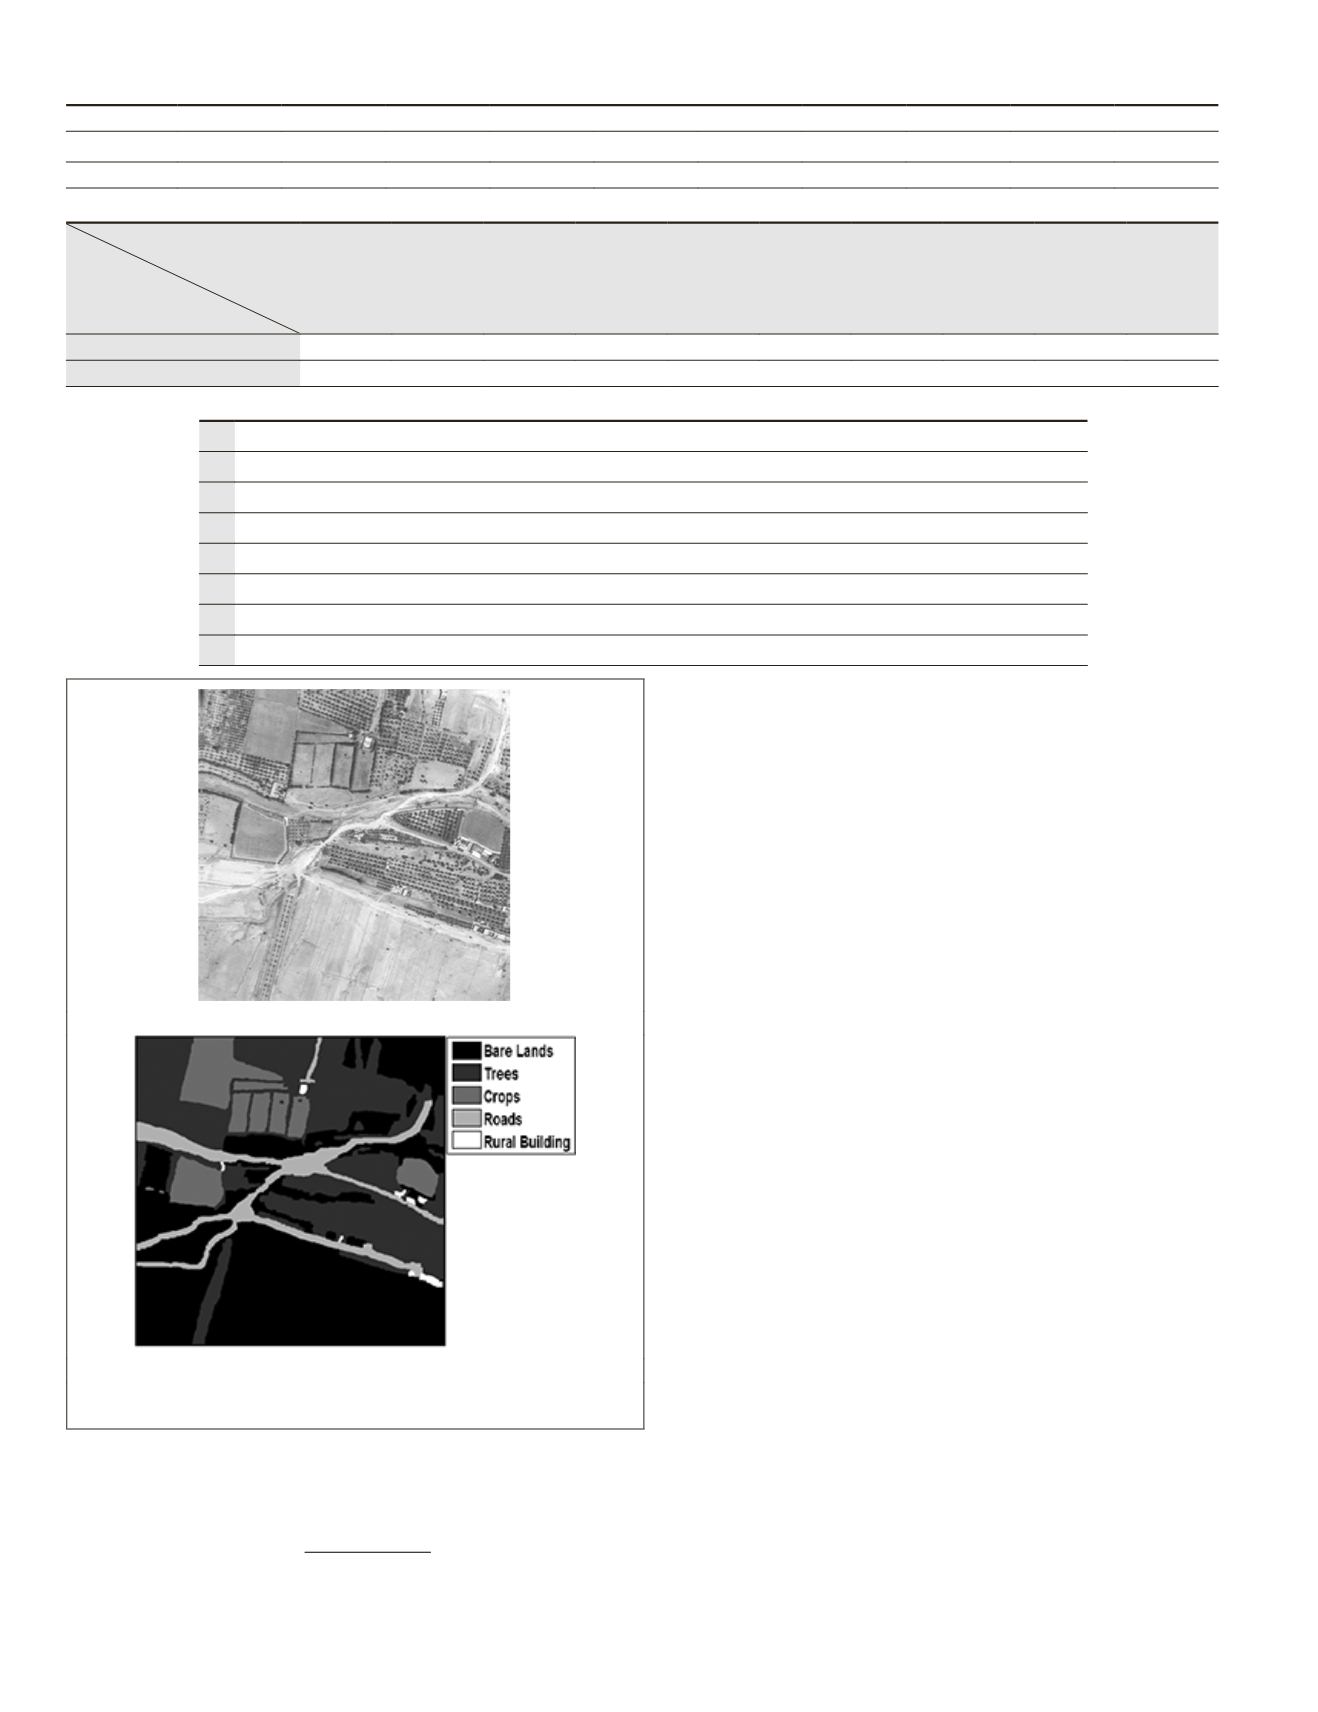
For calculating of distance between classes in these crite-
ria, a representative image that is manually labeled is used.
The representative image and the corresponding labeled im-
age are shown in Figure 3a and 3b, respectively.
The results in Table 3 show that except dissimilarity
features, decision of both criteria is same. For dissimilarity
features, scatter matrix decision that picks Diss_90 feature
is selected, because this criteria consider inter- and intra-
class distances simultaneously, but Bhattacharyya distance
consider only intra-class distance.
Feature Set Selection
In the previous section, one direction of directional features
was selected. Three feature types including Average, Entropy,
and Variance can be generated from both first order moment
(i.e., Ave_FOM, Ent_FOM and Var_FOM) and second
order
moment. In this step, for these features, a competition will
be done between the selected direction of second order and
another candidate in first order statistic. With this regard, 2
3
states (Table 4) are produced in which other essence feature
T
able
2. F
eature
S
election
R
esult with
J1, J2 C
riteria
in
S
tep
1
Type
Ave.
Cont.
Diss.
En.
Ent.
Hom.
Var.
Corr.
Clust.
Gabor
Decision J1 45, 135
0, 90
0, 90
45, 135 45, 135
0, 90
45, 135
0, 90
0, 90
45, 135
Decision J2 45, 135
0, 90
0, 90
45, 135 45, 135
0, 90
45, 135
0, 90
0, 90
45, 135
T
able
3. R
esults
of
I
nformative
D
irection
S
election
Features
Discriminate
criterion
Ave.45&135
Cont. 0&90
Diss. 0&90
En. 45&135
Ent.45 &135
Hom. 0&90
Var.45&135
Corr.0&90
Clust. 0&90
Gabor45&135
Scattering Matrix
Ave. 45 Cont. 0 Diss. 90 En. 45 Ent. 45 Hom. 90 Var. 45 Corr. 0 Clust. 0 Gabor 45
Bhattacharyya Distance
Ave. 45 Cont. 0 Diss. 0 En. 45 Ent. 45 Hom. 90 Var. 45 Corr. 0 Clust. 0 Gabor 45
T
able
4. S
tates
between
1
st
and
2
nd
O
rder
S
tatistics
to
S
elect
A
ppropriate
F
eature
S
et
Ave45, Con0, Diss90, En45, Ent45, Hom90, Var45, Corr0, Clust0, Skewness, Kurtosis, Gabor45
1
Ave_FOM, Con0, Diss90, En45, Ent45, Hom90, Var45, Corr0, Clust0, Skewness, Kurtosis, Gabor45
2
Ave45, Con0, Diss90, En45, Ent_FOM, Hom90, Var45, Corr0, Clust0, Skewness, Kurtosis, Gabor45
3
Ave45, Con0, Diss90, En45, Ent45, Hom90, Var_FOM, Corr0, Clust0, Skewness, Kurtosis, Gabor45
4
Ave_FOM, Con0, Diss90, En45, Ent_FOM, Hom90, Var45, Corr0, Clust0, Skewness, Kurtosis, Gabor45
5
Ave45, Con0, Diss90, En45, Ent_FOM, Hom90, Var_FOM, Corr0, Clust0, Skewness, Kurtosis, Gabor45
6
Ave_FOM, Con0, Diss90, En45, Ent45, Hom90, Var_FOM, Corr0, Clust0, Skewness, Kurtosis, Gabor45
7
Ave_FOM, Con0, Diss90, En45, Ent_FOM, Hom90, Var_FOM, Corr0, Clust0, Skewness, Kurtosis, Gabor45
8
(a)
(b)
Figure 3. (a) DS1 of QuickBird satellite image from a rural zone of
Fars State, and (b) land cover is labeled by an expert.
216
March 2016
PHOTOGRAMMETRIC ENGINEERING & REMOTE SENSING


