and widths of roads are increased, the optimum mask size for
clustering of
VHRSI
is set to 3 for next experiments.
The generalization result of the proposed method on the
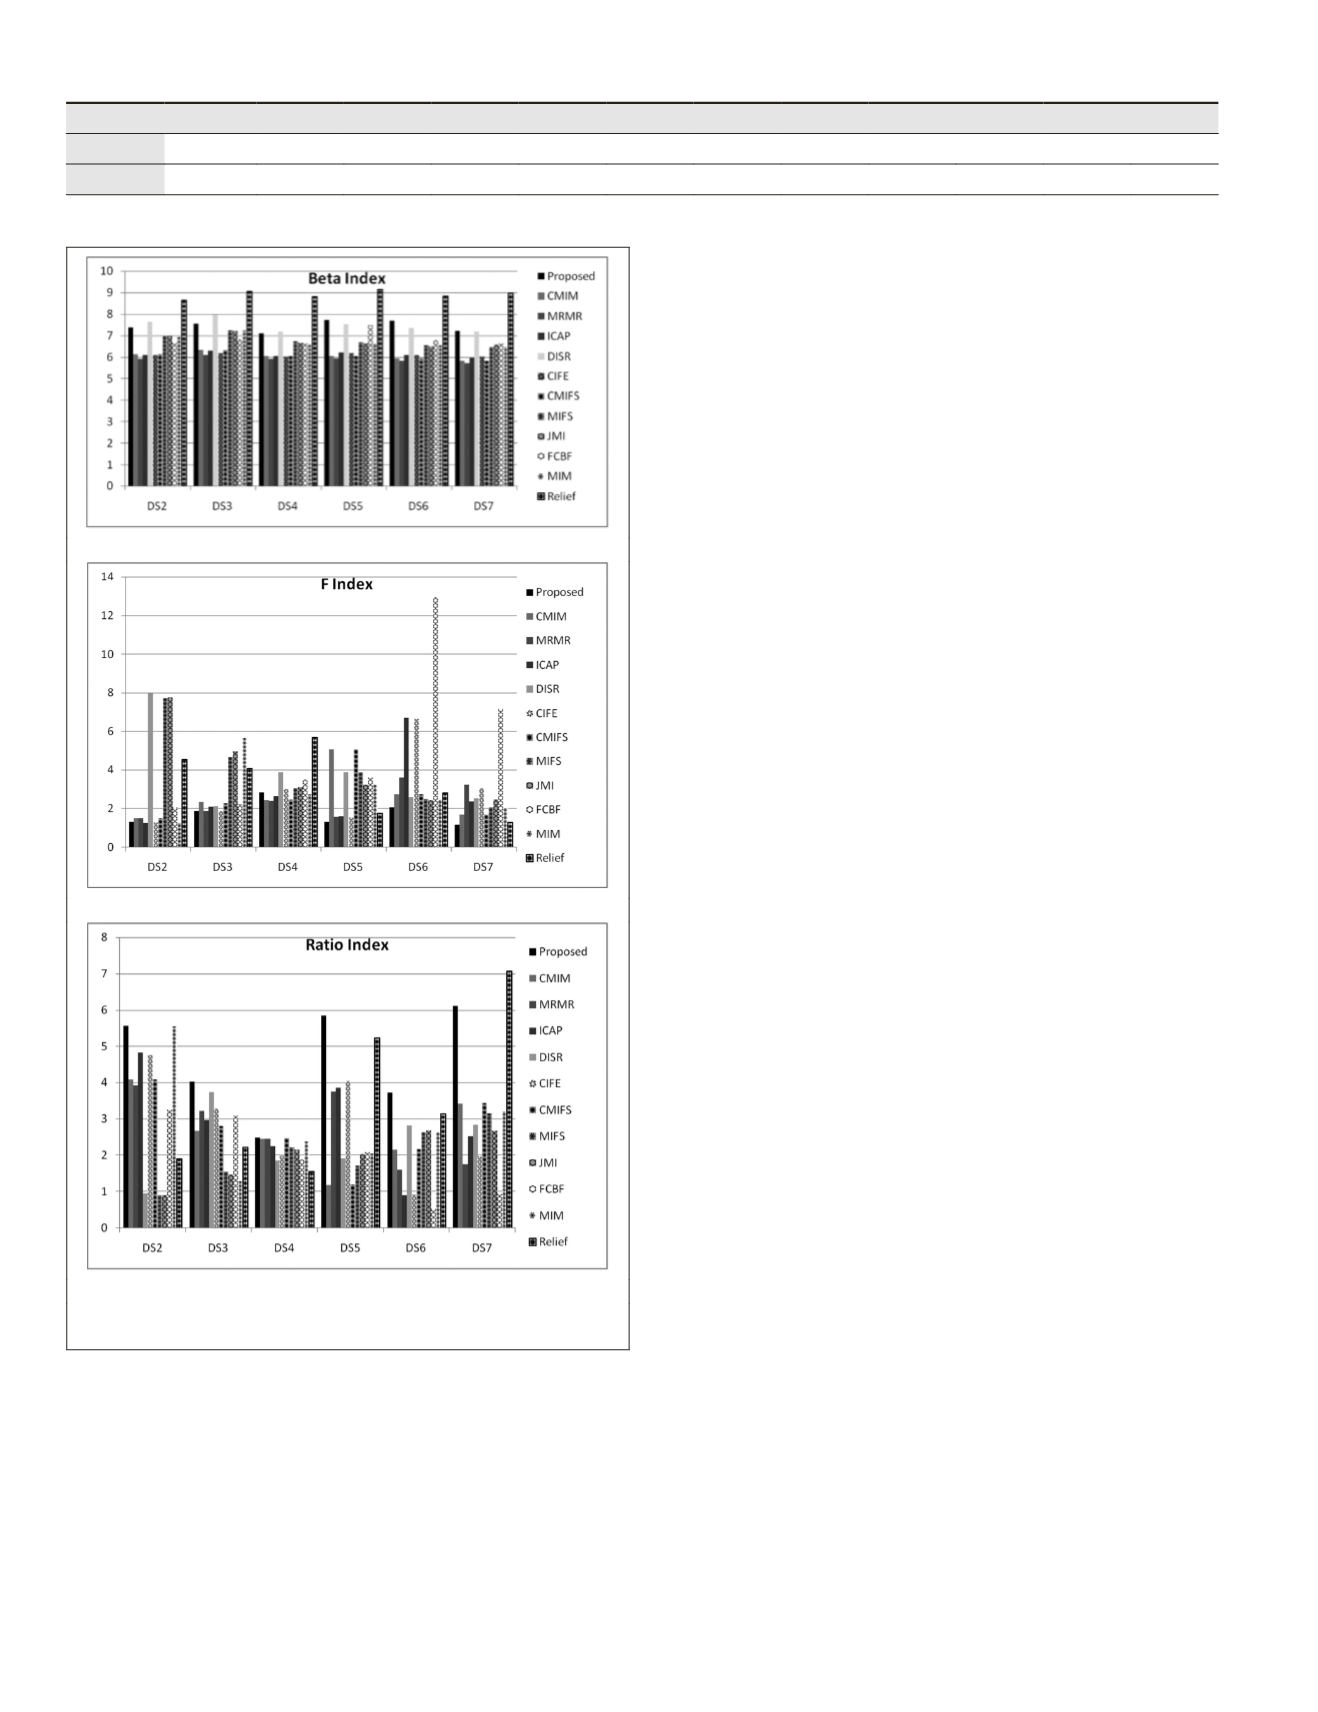
test datasets, when W = 3, are presented in terms of
β
,
F
, and
β
/
F
in Figures 9a, 9b, and 9c, respectively. The proposed
FS
method achieves better results in terms of three indexes in
comparison with 11
FS
methods except DISR and Relief meth-
ods. In particular, compared to the proposed
FS
method, the
Relief method provides better results in terms of
β
in Figure 9a
on all test datasets. It may due to the conceptual selection of
features by this method. In contrast, the proposed
FS
method
achieves appropriate results in terms of
F
on all dataset as
shown in Figure 9b. Moreover, the proposed
FS
method dem-
onstrates superiority in terms of
β
/
F
on all test datasets except
DS7 in Figure 9c. In Figure 9a, DISR yields almost comparable
results in comparison with the proposed
FS
method in terms
of
β
on all test datasets. In contrast, the proposed
FS
method
achieves superior results in terms of
F
and
β
/
F
on all dataset
as shown in Figures 9b and 9c, respectively.
To demonstrate the generalization capability of the
FS
methods, variance of
β
and
F
indexes using test datasets has
been obtained. The results for the proposed
FS
method and
the 11 other
FS
methods are given in Table 9. As seen in this
table, the proposed
FS
method provides minimum variance
over F which means appropriate generalization capability
of the method compared to the other
FS
methods. Also the
superiority of the proposed method is preserve in variance of
β
. Although the variance of
β
for the proposed
FS
method is
comparable with
ICAP
and
CIFE
methods, but these methods do
not yield appropriate results for image clustering and segmen-
tation in terms of three indexes.
To better illustrate the experimental demonstration of the
proposed methodology, two
FS
methods among 11 compared
methods which yield appropriate results on DS4 and DS7,
are selected based on
β
/
F
index shown in Figure 9c. Figure 10
illustrates the clustered images of DS7 by K-means clustering
using the proposed
FS
method and Relief method. In Figure
10c roads are clustered in two clusters while the pixels of
roads fall in a cluster in Figure 10b. Also this issue occurs for
trees in Figure 10b. In general, the proposed method almost il-
lustrates better results compared to Relief method demonstrat-
ing an appropriate performance among the compared methods.
In another comparison for DS4, the proposed
FS
method
is compared to
CMIM
and
MRMR
methods which their
β
/
F
are
maximum value in Figure 9c and the clustered images are
demonstrated in Figure 11. Note that the different legend
obtained in this Figure 11 is due to random selection of initial
clusters in K-means clustering algorithm. As illustrated,
discrimination of crops from trees in Figure 11b is better than
both Figures 11c and 11d. Moreover, some rows of trees in
both Figures 11c and 11d are clusters in a different cluster.
Conclusions
The purpose of this paper was to select the suitable spatial
and spectral features to be used in segmentation of
VHRSI
. In
the proposed
FS
method, the effective feature types based on
reasonable facts regarding agricultural areas were predefined
and selected the best candidate features for each feature
type without an effortful search. The features selected from
a labeled image can be used in clustering of images captured
by different satellites with similar spatial resolution. The
proposed
FS
method includes three steps: (a) feature type
selection, (b) candidate selection, and (c) model selection.
The performance of the proposed method and 11 well-known
FS
methods were compared and analyzed for different mask
sizes. The results show superiority for the proposed method.
In sum, some advantages of the proposed
FS
method are as
following: it can be applied to images from similar satel-
lite (e.g., World view, Pleiades and Ikonos), it results in low
over-segmentation, it does not need effortful search strategy
in selection of the best features, and also it needs labeling task
only for one image. As for future work, we are going to reach
the final segmentation. In final segmentation, any segment ap-
proximately corresponds to a ground object. For this purpose,
T
able
9. V
ariance
of
I
ndexes
C
alculated
for
11 FS M
ethods
on
T
est
D
atasets
variance Proposed CMIM MRMR ICAP DISR CIFE CMIFS MIFS JMI
FCBF MIM Relief
Var(
β
)
0.11
0.169 0.114
0.1
0.53
0.1
0.15
0.30
0.30 0.130 0.303 0.540
Var(F)
0.37
1.98
2.35
4.28
5.87
4.40
1.91
4.99
4.96
15.3
4.49
3.37
(a)
(b)
(c)
Figure 9. The proposed method compared to 11 methods for test
datasets, (a) β index, (b) F index, (c) β/F index.
220
March 2016
PHOTOGRAMMETRIC ENGINEERING & REMOTE SENSING


