The effects of mitigating vignetting on dynamic range are
difficult to document, as the brightness fall off artificially
enlarged the range on the low end, with no effect on the high
end for the images tested. As shown in Figure 6, slightly
underexposed images had less overall vignetting (by 1 to 2
percent across all
f-
stops tested). The vignetting correction
process built into the camera, as shown in Figure 6, decreased
vignetting slightly, but mitigated no more than approximately
10 percent of the
DN
value drop between 0.67 and 0.77.
Image Visual Acuity Assessment -
ISO
The effects of
ISO
settings on visual acuity were assessed by
repeating the crack detection pixel profile experiment using
image pairs with higher
ISO
values (200 to 6400). a visual as-
sessment of various
ISO
values, across several images, yielded
the set of observations in Table 2. These observations are
consistent across image sets captured at different times of day,
times of year, and of different scenes. Image (“shot”) noise
occurring at higher gain settings is sufficiently minor and ran-
dom enough relative to random fluctuations created by image
alignment and light meter fluctuations, only minor influences
on detectability of the simulated crack test images is observ-
able between image pairs with different
ISO
values.
Using a common ground speed of 120 km/h (75 mph)
(3,333 cm/sec) with an anticipated
GSD
of 7.5 cm, and an ideal
AIM
of less than one, we determined that that shutter speeds
faster than 1/407 sec (rounded to 1/400 sec) are needed to
avoid potential motion blur. Shutter speeds faster than 1/400
were selected by the camera auto-exposure program during
the imagery collections, although a fixed shutter speed mini-
mum value (preferable) and/or aperture priority should be set
on the camera to insure a consistently adequate shutter speed.
Table 2. Qualitative evaluation of the image noise present in
images of differing
ISO
levels.
ISO
Qualitative Observations
100 High visual acuity, no visible image artifacts, sharp object edges
200 High visual acuity, no visible image artifacts, sharp object
edges, indistinguishable from
ISO
100
400 Good visual acuity, noticeable image noise in areas of high
homogeneity
800 Average visual acuity, image artifacts present throughout
image, borderline usability for detection of small objects
>1600 Visual acuity loss is significant, large image artifacts
throughout the image, likely unusable for applications
requiring detection of small objects
Temporal Consistency - Background Noise Reduction
In order to evaluate the
EV
bias that provided the greatest tem-
poral consistency between dates, images captured at two times
of day, on two different dates, of the same scene are compared
against each other. Over the course of an approximately 20
min imagery collection, conditions in the scene were mostly
static, and no damage or change features were simulated.
The assumption is that most pixels detected as changed are
representative of variations (i.e., noise) caused by differential
camera settings, rather than actual changes in the scene.
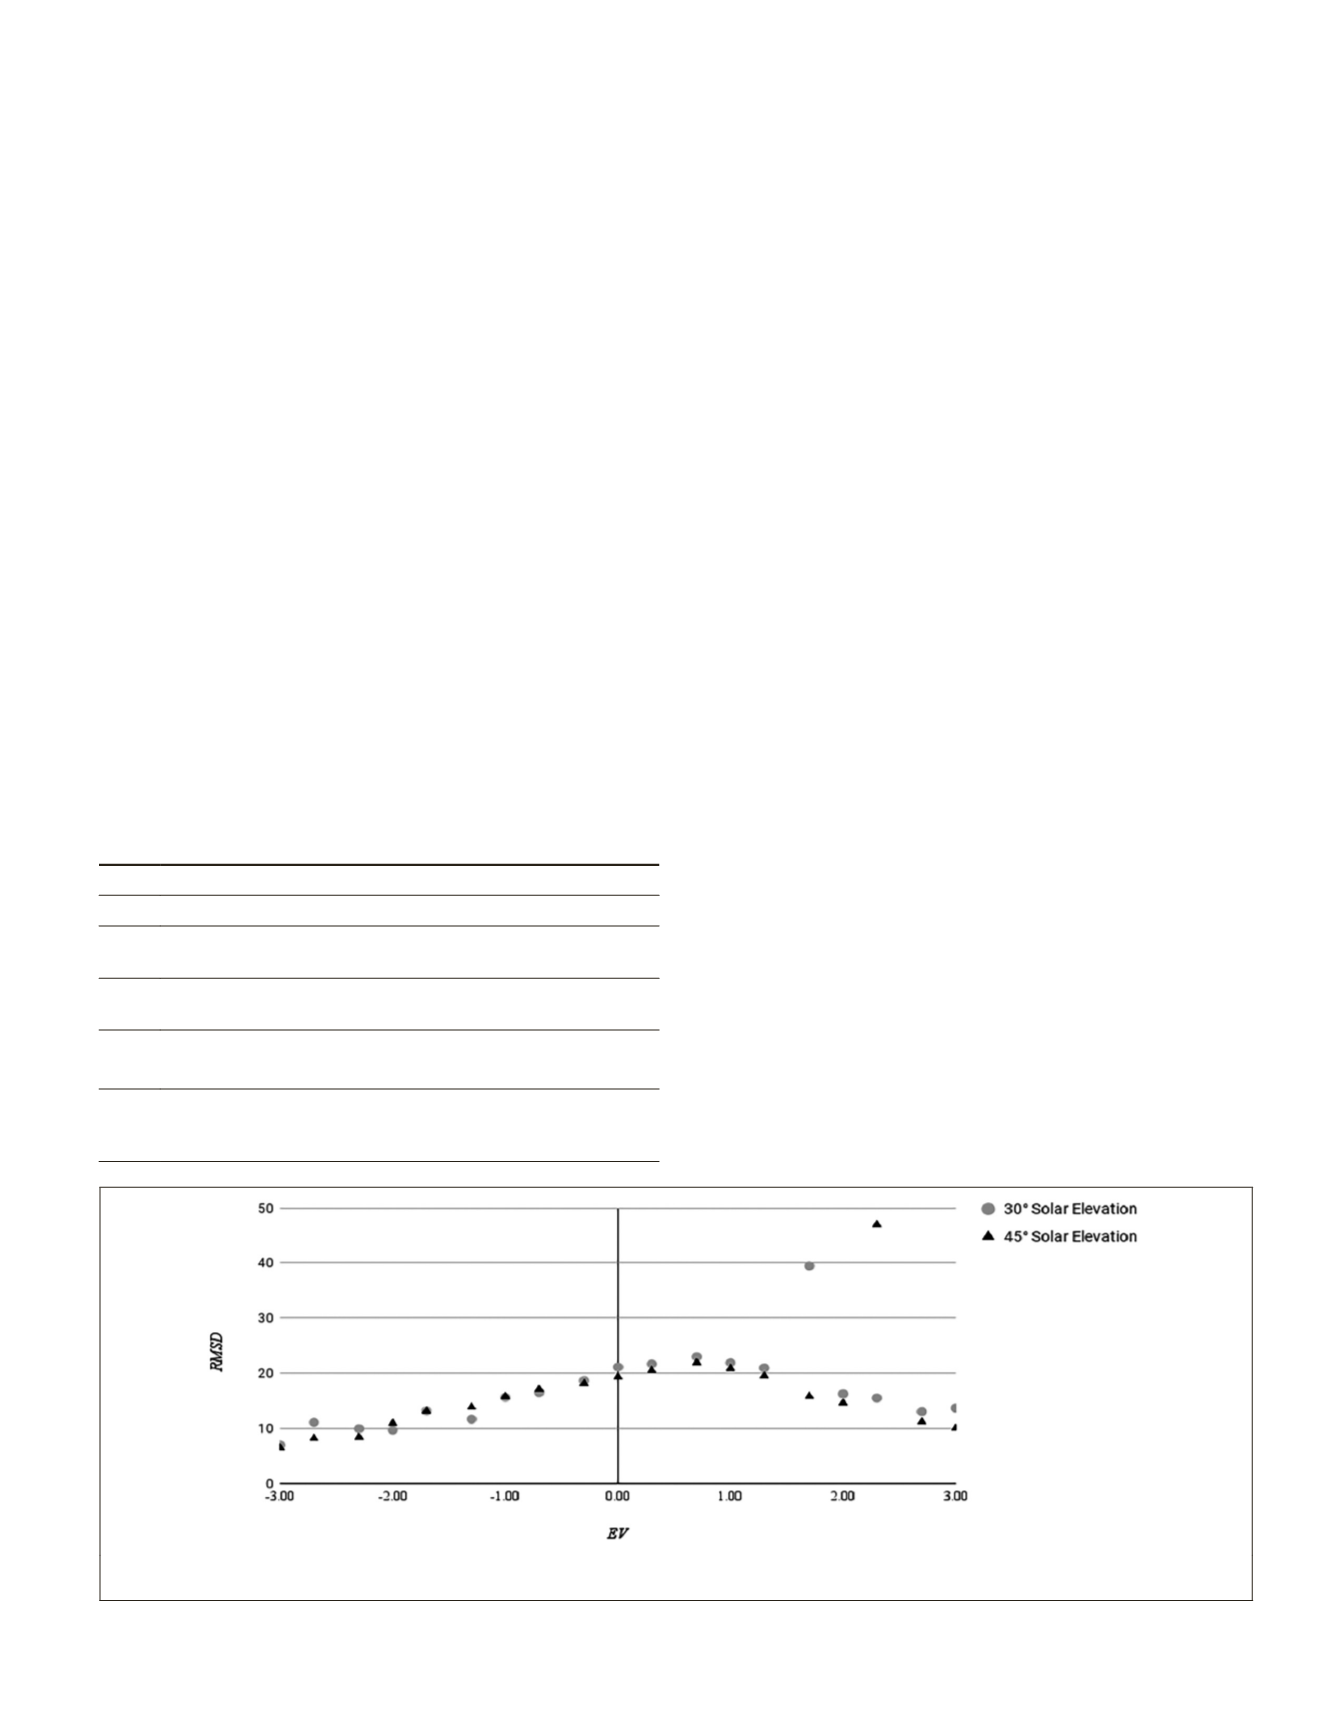
Bi-temporal image pairs of the same exposure bias, from
the same time of day, were used to create difference images,
from which their
RMSD
was plotted in Figure 7. The lowest
RMSD
value occurring at
EV
−3 indicates the lowest image
noise, whereas the peak (“noisiest”)
RMSD
value is around
EV
+0.7. The cause of the two outlier
RMSD
values is indeter-
minate, although, it is suspected that they stem from lower
visual acuity resulting from movement of the camera.
Temporal Consistency - Light Metering Method
Light metering consistency was compared between center
weighted and overall weighted metering methods, across a
total of 755 images, captured across four dates in June, at two
sites, and at two times of day. For every collection,
EV
14.7
was the most common
EV
for images with an exposure bias of
± 0, as shown in Table 3. Thus, it was selected as the
EV
level
from which to calculate the offset between
EV
bias and camera
configuration
EV
, relative to 0.
As shown in Table 4, center weighted metering outper-
forms overall weighted metering by 19 percent for images
with no offset at all, and by 2 percent for images with an
offset of ± 0.3EV. The selected value of 14.7EV matched
well with both the 30° and 45° solar elevation angles, with
93 percent and 96 percent falling within ± 0.3EV of 14.7EV,
respectively.
Simulated Damage Assessment - Crack Detection
Examples of simulated pre-damage and post-damage image
subsets are shown in Figures 8a and 8b, respectively. Image
pairs were used to create difference images, from which a
trio of 74 horizontal pixel profiles were extracted, and then
averaged into a single row of 74 pixels (to minimize random
noise effects). An analysis of spatial acuity of the images was
done by examining the pixel profiles, while an
SNR
metric was
based on calculating the difference magnitude and spatial gra-
dient across the simulated cracks, relative to the background
noise (
RMSD
of difference image for the non-crack area).
Figure 9a shows the difference magnitude of the pixel
profiles, with the value of each pixel in the profile squared,
Figure 7. Root means square difference (
RMSD
) intensity values derived from bi-temporal image pairs from 30° and 45° solar
elevation June 25 and 26 collections at La Jolla site (Lower values mean lower noise levels).
PHOTOGRAMMETRIC ENGINEERING & REMOTE SENSING
March 2018
155


