ROIs
; Figure 8). First, the size of each
ROI
that comprised a
homogeneous patch of deciduous rubber plantation or natural
evergreen forest was larger than 0.02 km
2
(or 16 pixels) or 0.10
km
2
(or 121 pixels), respectively. Second, any two adjacent ar-
eas had a distance of more than 0.5 km. Third, more
ROIs
were
used to validate the presence of deciduous rubber plantations
than natural evergreen forests. Finally, all the validation
ROIs
were necessarily cloud-free.
It is noteworthy that
ROI
validation could only be per-
formed after 1995, due to the availability of
GE
images for the
study area. We therefore acquired the related
ROIs
in 2016 as
well as the other four time periods based on all available
GE
images over Xishuangbanna between 1996 and 2016 (Fig-
ure 1b), encompassing a total of 91
ROIs
(14,655 pixels) for
deciduous rubber plantations and 30
ROIs
(9596 pixels) for
natural evergreen forests in 2016 (Figure 8a). We used 73
ROIs
(9279 pixels) for deciduous rubber plantations and 25
ROIs
(5414 pixels) for natural evergreen forests during the period
between 2011 and 2015 (Figure 8b), 65
ROIs
(9858 pixels) for
deciduous rubber plantations and 23
ROIs
(9070 pixels) for
natural evergreen forests during the period between 2006 and
2010 (Figure 8c), 59
ROIs
(5527 pixels) for deciduous rubber
plantations and 22
ROIs
(5384 pixels) for natural evergreen
forests during the period between 2001 and 2005 (Figure 8d),
and 31
ROIs
(6962 pixels) for deciduous rubber plantations
and 19
ROIs
(5549 pixels) for natural evergreen forests during
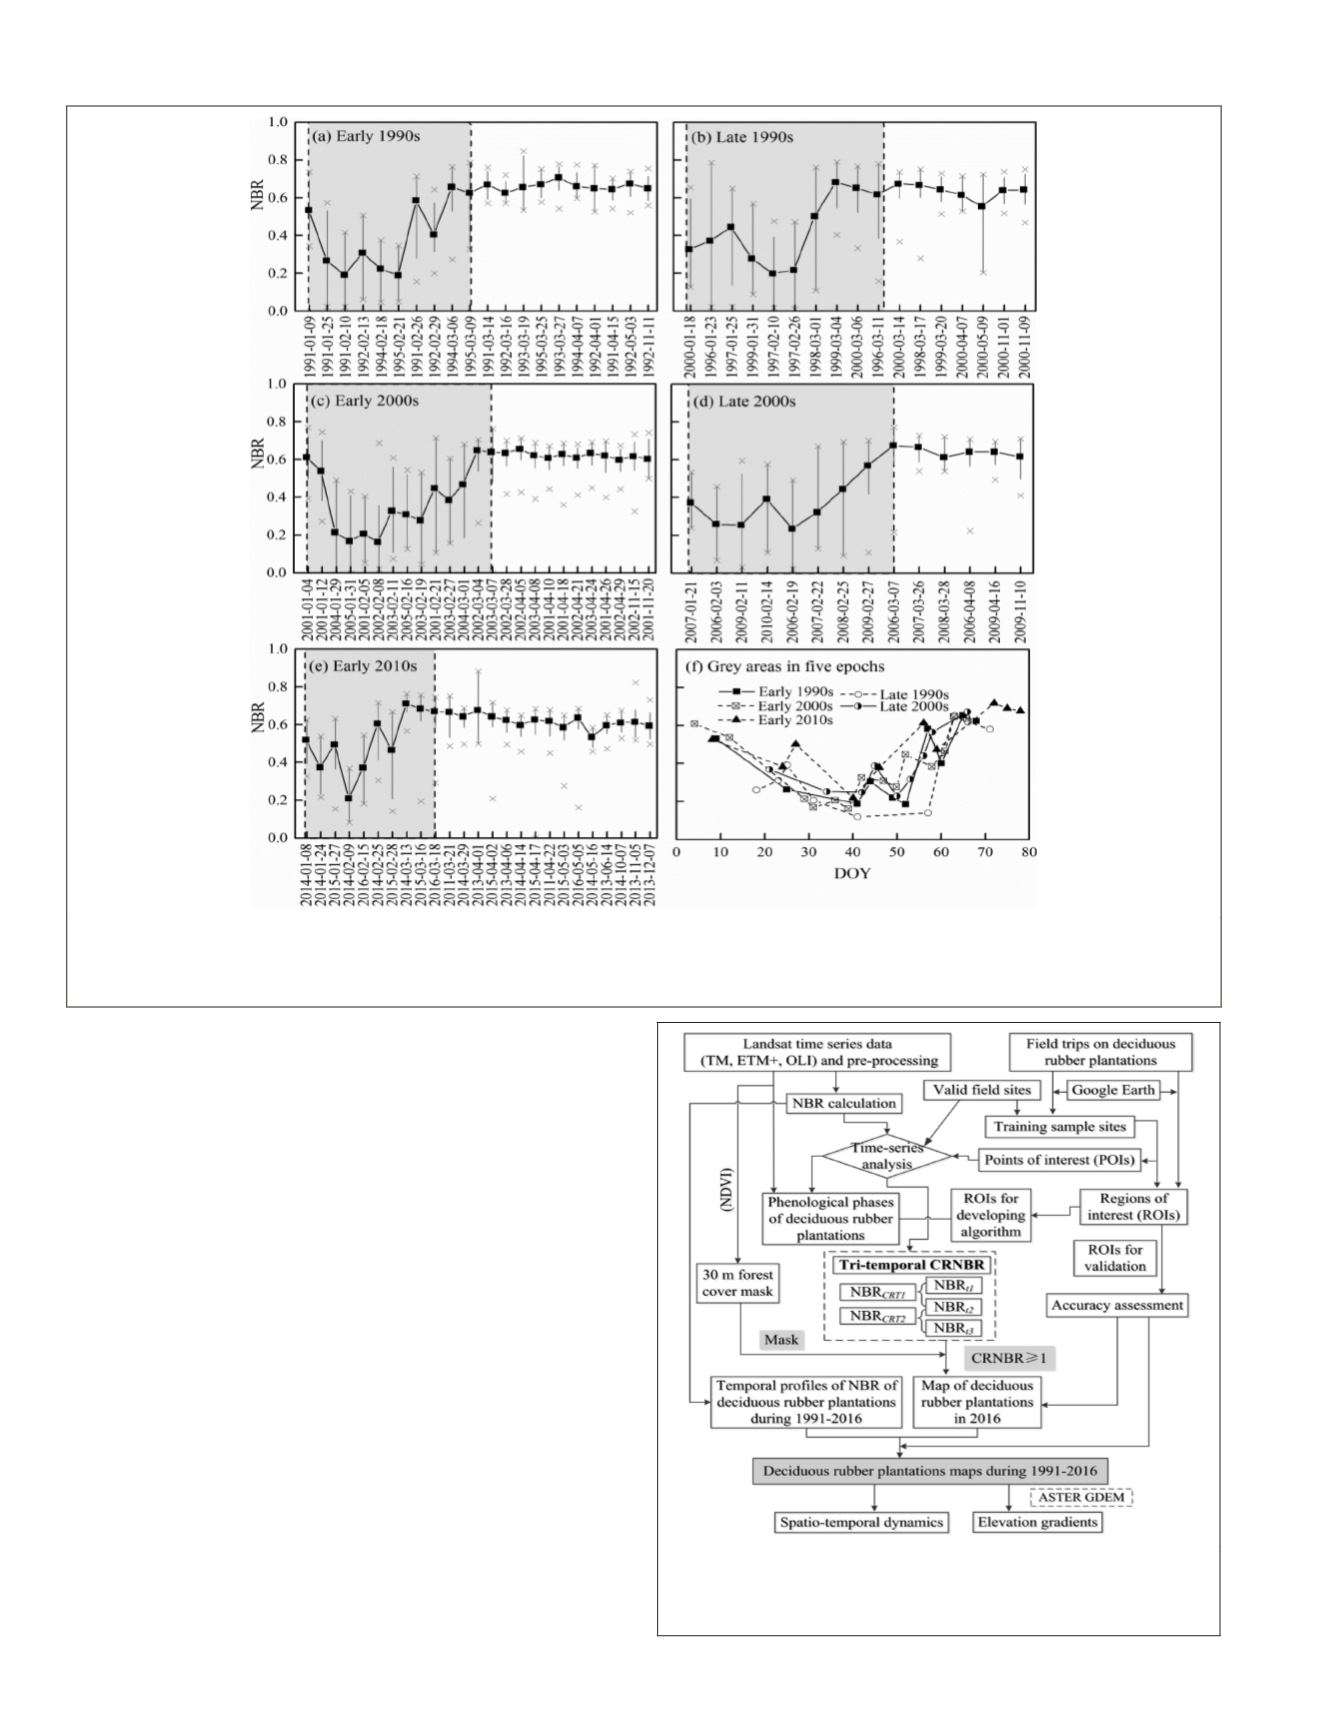
Figure 5. The phenological development of deciduous rubber plantations delineated by Landsat-derived
NBR
with 38 regions
of interest (1548 pixels) over the five time periods: (a) early 1990s, (b) late 1990s, (c) early 2000s, (d) late 2000s, and (e) early
2010s. The black solid dots and X symbols denote the average and maximum (or minimum) values, while the gray areas
indicate the periods of rapid phenological transition.
Figure 6. The framework used for mapping deciduous
rubber plantations in Xishuangbanna based on a phenology-
based tri-window algorithm of the Change Rate of
Normalized Burn Ratio (
CRNBR
).
692
September 2019
PHOTOGRAMMETRIC ENGINEERING & REMOTE SENSING


