A Phenology-Based Tri-Window Algorithm
and Mapping Deciduous Rubber Plantations
As noted, the temporal development of deciduous rubber
plantations can be categorized into three phases (i.e., predefo-
liation, defoliation, and foliation) or two critical growth pe-
riods (i.e., senescence and regreening). The phenology-based
tri-window algorithm based on
CRNBR
through the modifica-
tion of our recently reported method (i.e., bi-temporal
NBR
;
Li
et al.
2015) was developed and used to identify deciduous
rubber plantations in this study (Figure 6).
We calculated the
CRNBR
to differentiate defoliating from
foliating signals of deciduous rubber plantations during the
senescence and regreening periods, as follows:
CRNBR NBR NBR NBR
NBR NBR NBR
=
-
(
)
=
-
(
)
t
t
t
t
t
t
1
2
2
3
2
2
,
(3)
where
t
1,
t
2, and
t
3 denote the acqu
scenes, respectively, while NBR
t
1
, N
values of this ratio in the predefolia
foliation phase with Equation 1. Si
notes the change rate of
NBR
betwee
(i.e., the senescence period from
t
1 to
t
2 and the regreening
period from
t
2 to
t
3). Over this time period, deciduous rubber
plantations can be identified as undergoing defoliation with
the corresponding
CRNBR
values much larger than or equal to
1.0. This contrasts with other land cover types (e.g., natural
evergreen forests) which change slightly, with
CRNBR
values
typically less than 1.0. Three Landsat images acquired in the
senescence and regreening periods were then used to map
deciduous rubber plantations, via spatial-overlay analysis on
the basis that
CRNBR
values of pixels simultaneously meet the
criteria of scene-based senescence and g regreening periods,
by combining a Landsat-derived forest mask (
NDVI
larger than
0.60; Li
et al.
2015). Similarly, the historical maps of decidu-
ous rubber plantations were obtained from the five periods
between 1991 and 2015 at an interval of five years (Figure 7).
This contributes to our explicit understanding of how decidu-
ous rubber plantations have spatially expanded in Xishuang-
banna since the 1990s.
ment
to estimate the accuracies of the
sion matrices. Four basic rules
ng validation sample plots (i.e.,
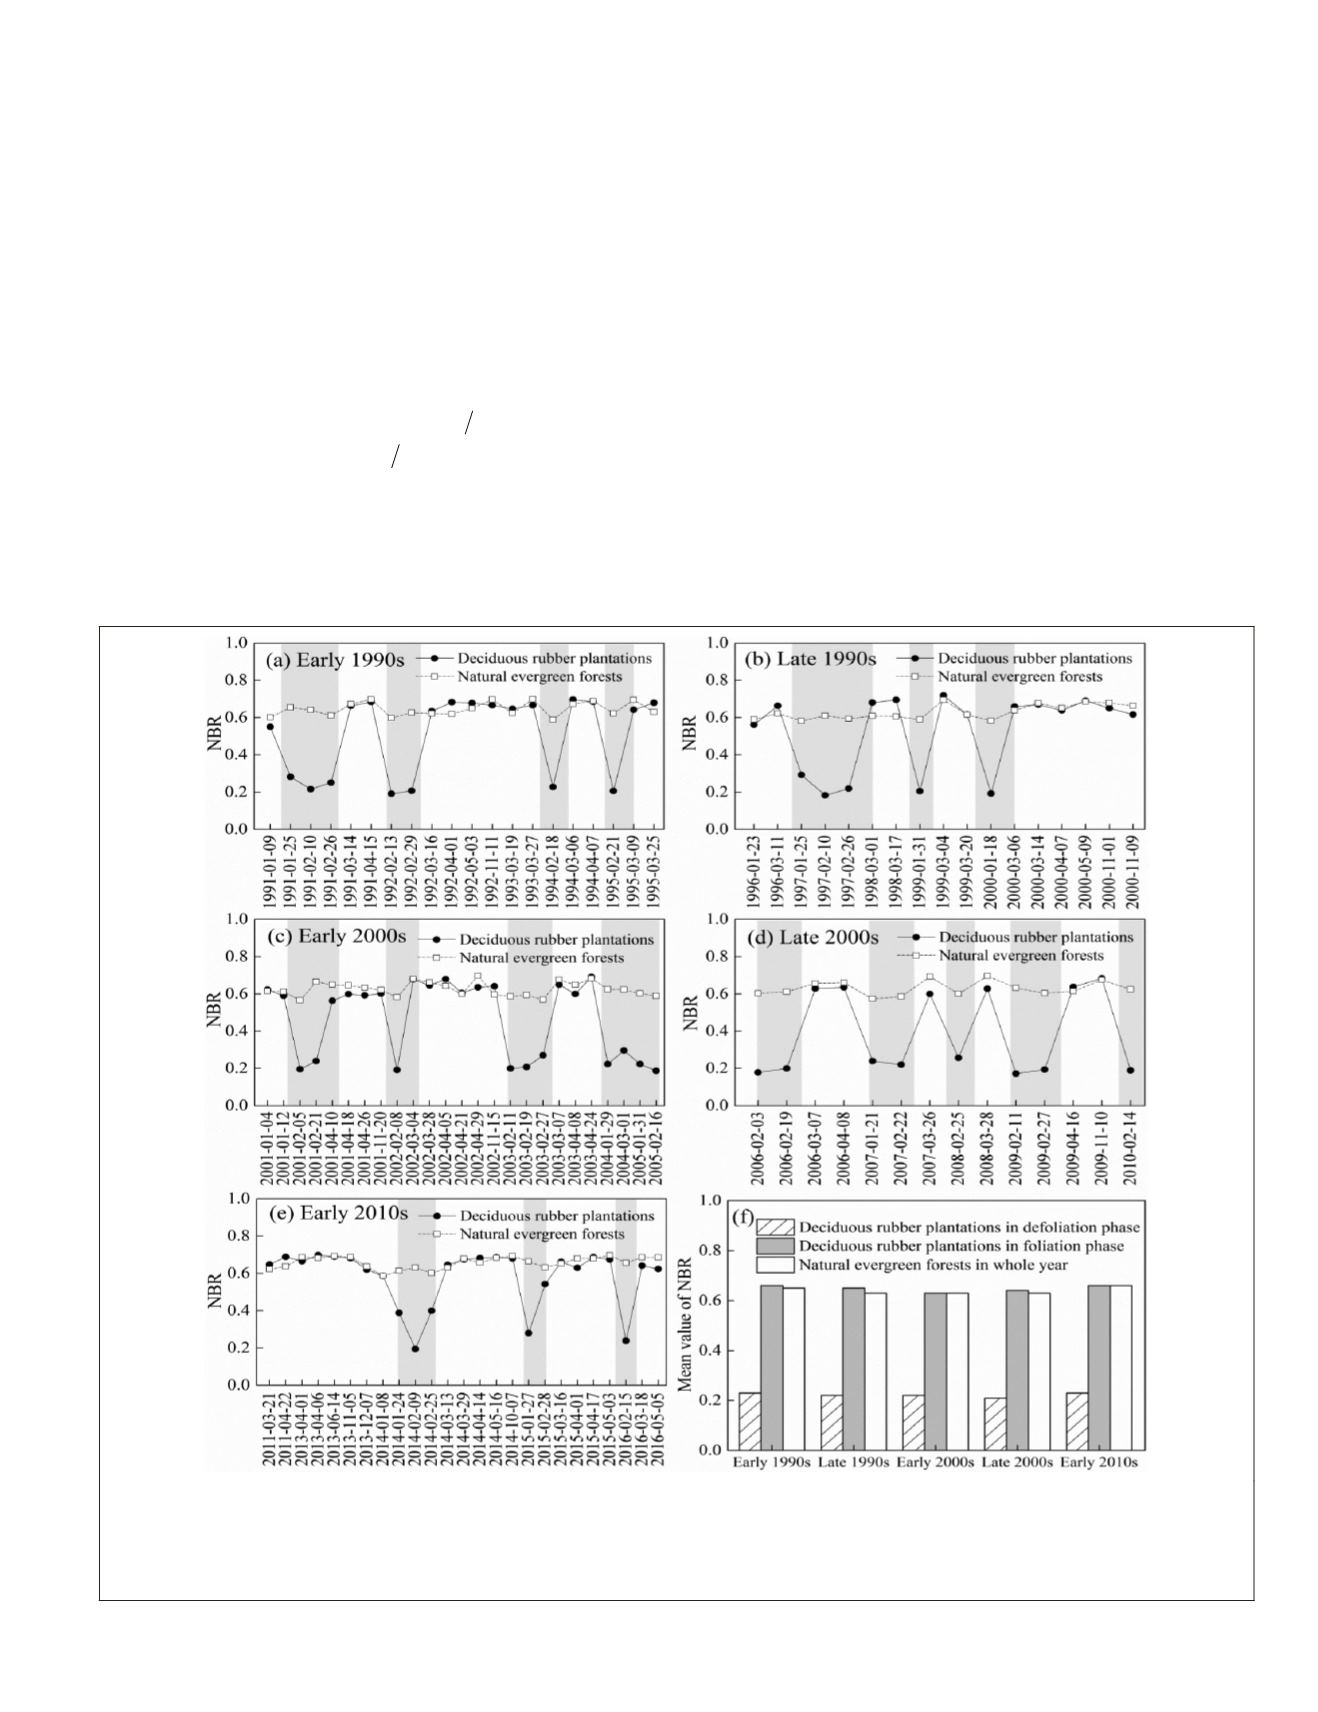
Figure 4. Temporal profiles of values of
NBR
for deciduous rubber plantations (12
POIs
) and natural evergreen forests (six
POIs
) generated in the (a) early 1990s, (b) late 1990s, (c) early 2000s, (d) late 2000s, and (e) early 2010s. (f) Average
NBR
of
deciduous rubber plantations and natural evergreen forests for the five epochs. Gray areas highlight temporal differences
in average
NBR
values between deciduous rubber plantations and natural evergreen forests during the dry season (between
January and April).
PHOTOGRAMMETRIC ENGINEERING & REMOTE SENSING
September 2019
691


