Landsat-based phenological algorithm has spatially expanded
in Xishuangbanna in recent decades is not clearly understood.
In this study, the phenology-based tri-window (i.e., pre-
defoliation, defoliation, and foliation) algorithm based on the
change rate of
NBR
(
CRNBR
) through the modification of our
recently reported method (i.e., bi-temporal
NBR
) was developed
and then applied to generate longitudinal maps of deciduous
rubber plantations in Xishuangbanna during 1991–2016. Our
objective was twofold: to evaluate the performance of the tri-
temporal
CRNBR
in mapping deciduous rubber plantations and
to generate historical maps of deciduous rubber plantations
and examine their spatio-temporal expansion dynamics. If fea-
sible, this approach could be expandable for reconstructing the
change trajectories of deciduous rubber plantations in other
regions of the tropics, such as China’s Hainan Island and
MSEA
.
Materials and Methods
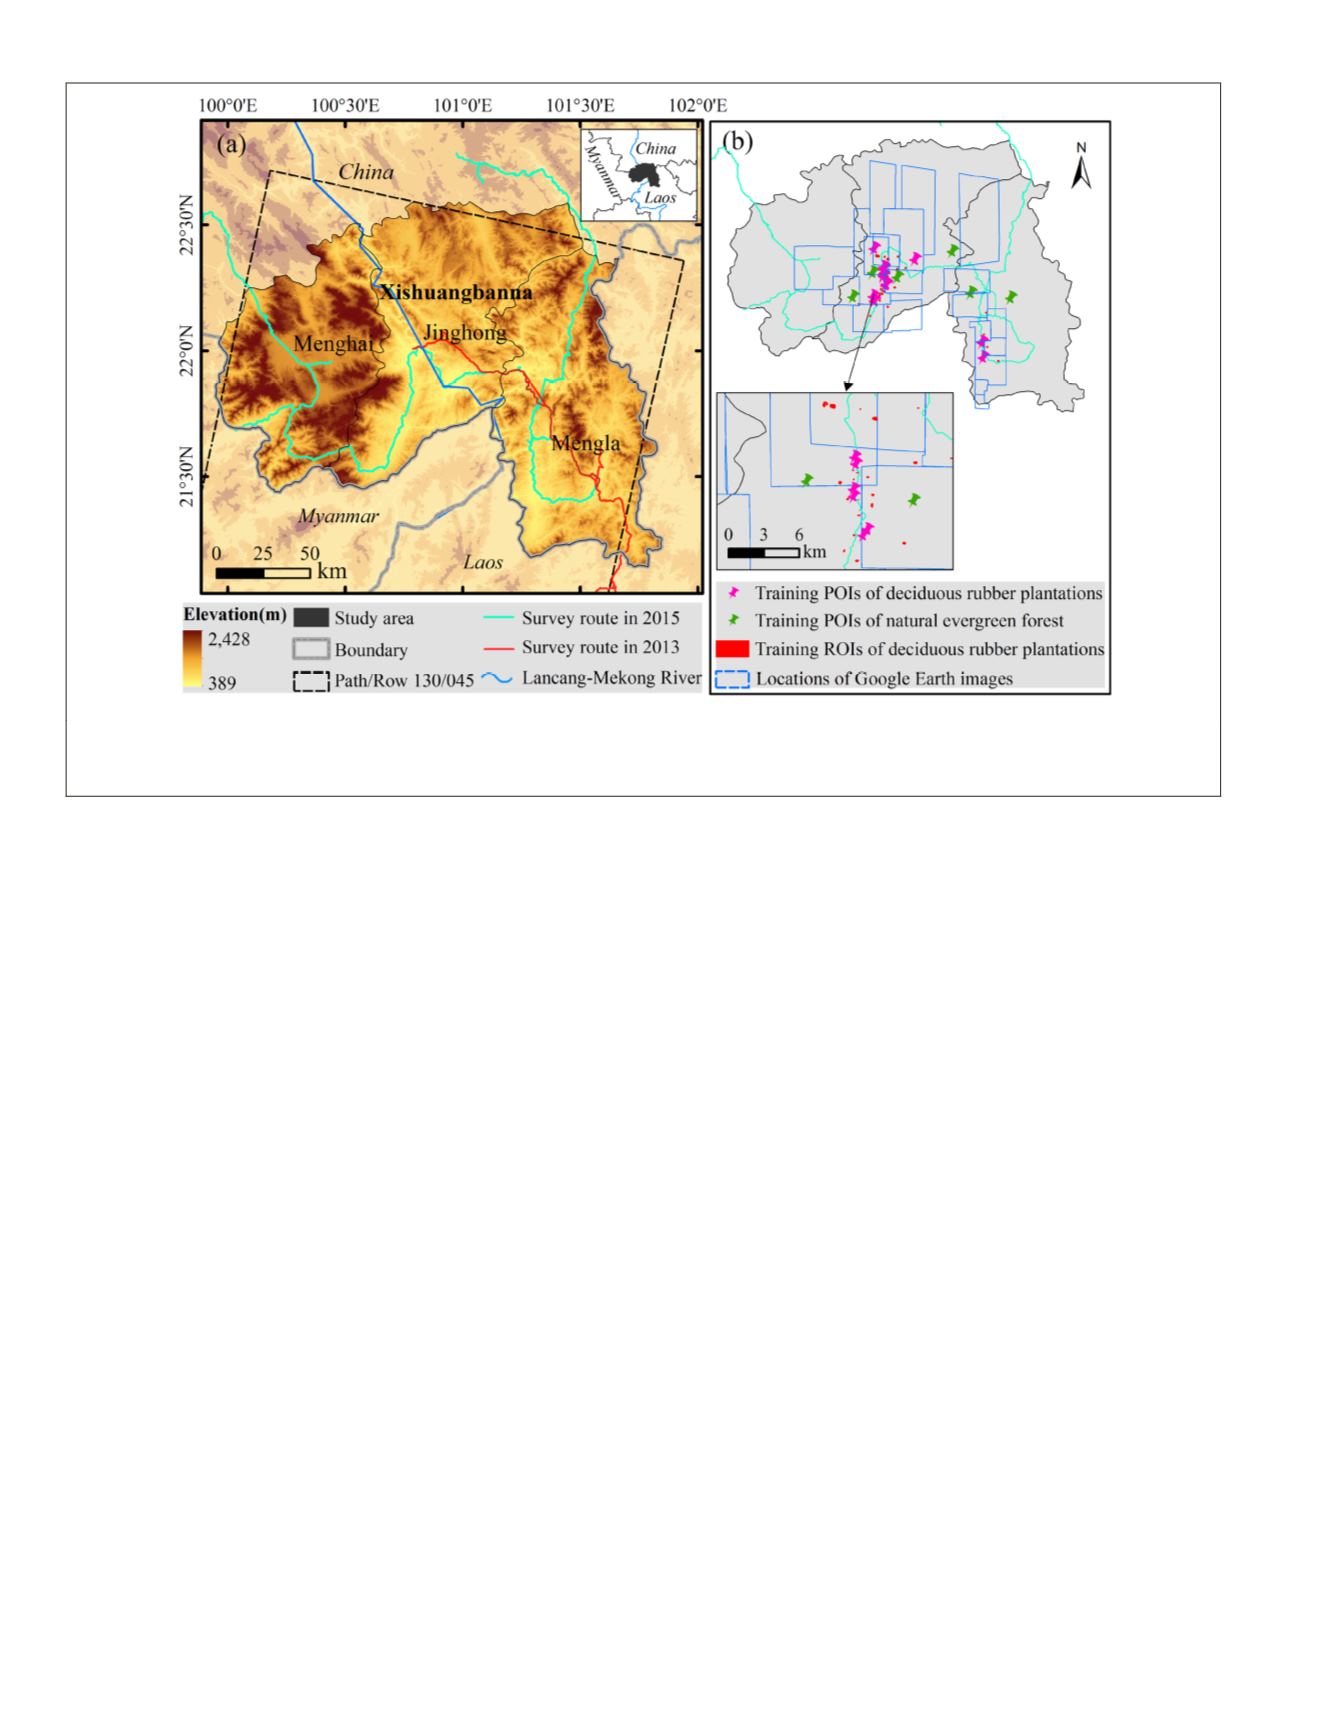
Study Area
Located in southern Yunnan, China, and bordering Laos and
Myanmar (Figure 1a), Xishuangbanna is the second largest
natural rubber planting area of the country. Approximately
95% of the study area (19,120 km
2
) is mountainous landscape
at elevations ranging between 389 and 2428 m above sea level
(derived from the Advanced Spaceborne Thermal Emission
and Reflection Radiometer Global Digital Elevation Model
(
ASTER GDEM
); Tachikawa, Hato,
et al.
2011). Xishuangbanna
has a tropical/subtropical monsoon climate, with a dry season
from November to April and a rainy season between May and
October. The average annual precipitation and temperature
are around 1317 mm and 22°C. The dominant natural for-
ests are tropical monsoonal, tropical seasonal moist, tropical
rainforest, and subtropical monsoonal broad-leaved. Natural
forests within the study area are mostly evergreen all year
round, while the non-native rubber trees display deciduous
characteristics, shedding their leaves for two to four weeks
from February to March (Mann 2009).
Landsat TM/ETM+/OLI Images and Data Preprocessing
LTS
data products, including surface reflectance of multi-
spectral bands, the C version of Fmask, and several spectral
indices (e.g.,
NBR
and
NDVI
) were freely gathered from the U.S.
Geological Survey’s (2016) Earth Resources Observation and
Science) Center Science Processing Architecture. These Level
1 terrain-corrected data products have received geometric,
radiometric, and precision corrections. Atmospheric cor-
rection of surface-reflectance data was performed using the
Landsat Ecosystem Disturbance Adaptive Processing System
algorithm developed by the U.S. Geological Survey (Masek
et al.
2006). As 96% of Xishuangbanna is covered by a single
Landsat footprint (path/row 130/045; Figure 1a), there were a
total of 726
LTS
images (i.e.,
TM
,
ETM+
, and
OLI
) acquired dur-
ing 1991–2016. Among the 726 scenes, nearly 37.9% of them
had
≥
30%
CC
, less than those over China (49.6%; Xiao
et al.
2018) and
MSEA
(41.1%; Li
et al.
2018). However, the average
probability of acquired target images rose to 72.1% during the
dry season, which highlights the availability of
LTS
images in
this period. Considering the unique features (i.e., defoliation
and foliation) of deciduous rubber plantations, a total of 100
cloud-free or low-
CC
(i.e., 30% and less) Landsat scenes dur-
ing the dry season (mainly between January and April)—67
TM
, 12
ETM+
, and 21
OLI
images (Figure 2)—were utilized to
construct temporal curves of
NBR
. From them, 18
TM
,
ETM+
,
and
OLI
images were further selected to map deciduous rubber
plantations.
In this study, both
NDVI
(Rouse
et al.
1973) and
NBR
(López
García and Caselles 1991) were calculated using surface-
reflectance values for the 100 scenes. We then utilized time-
series
NBR
data to generate temporal profiles of deciduous rub-
ber plantations and develop the phenology-based tri-window
algorithm to produce maps in 2016 and the five historical
Figure 1. (a) Maps showing the location and topography of Xishuangbanna as well as field-survey routes in 2013 and 2015.
(b) Distribution of the footprints of Google Earth images for the selection of training points of interest (
POIs
) and regions of
interest (
ROIs
) of deciduous rubber plantations and natural evergreen forests.
688
September 2019
PHOTOGRAMMETRIC ENGINEERING & REMOTE SENSING


