plantations changed significantly (quasi-U-shape) within the
senescence and regreening periods, although showing slight
annual differences (Figure 5f) due to temporal differences
caused by local climate variability. Average
NBR
values of
deciduous rubber plantations decreased significantly, from
about 0.65 during the predefoliation phase to merely 0.15 in
the defoliation phase, or over the course of the senescence
period (i.e., between
t
1 and
t
2). As average
NBR
values in-
creased rapidly during the regreening period (i.e., between
t
2
and
t
3), or from 0.15 in the defoliation phase to 0.70 in the
foliation phase, we used the
NBR
derived from the two periods
of
LTS
imagery as criteria to extract the phenological features
of deciduous rubber plantations.
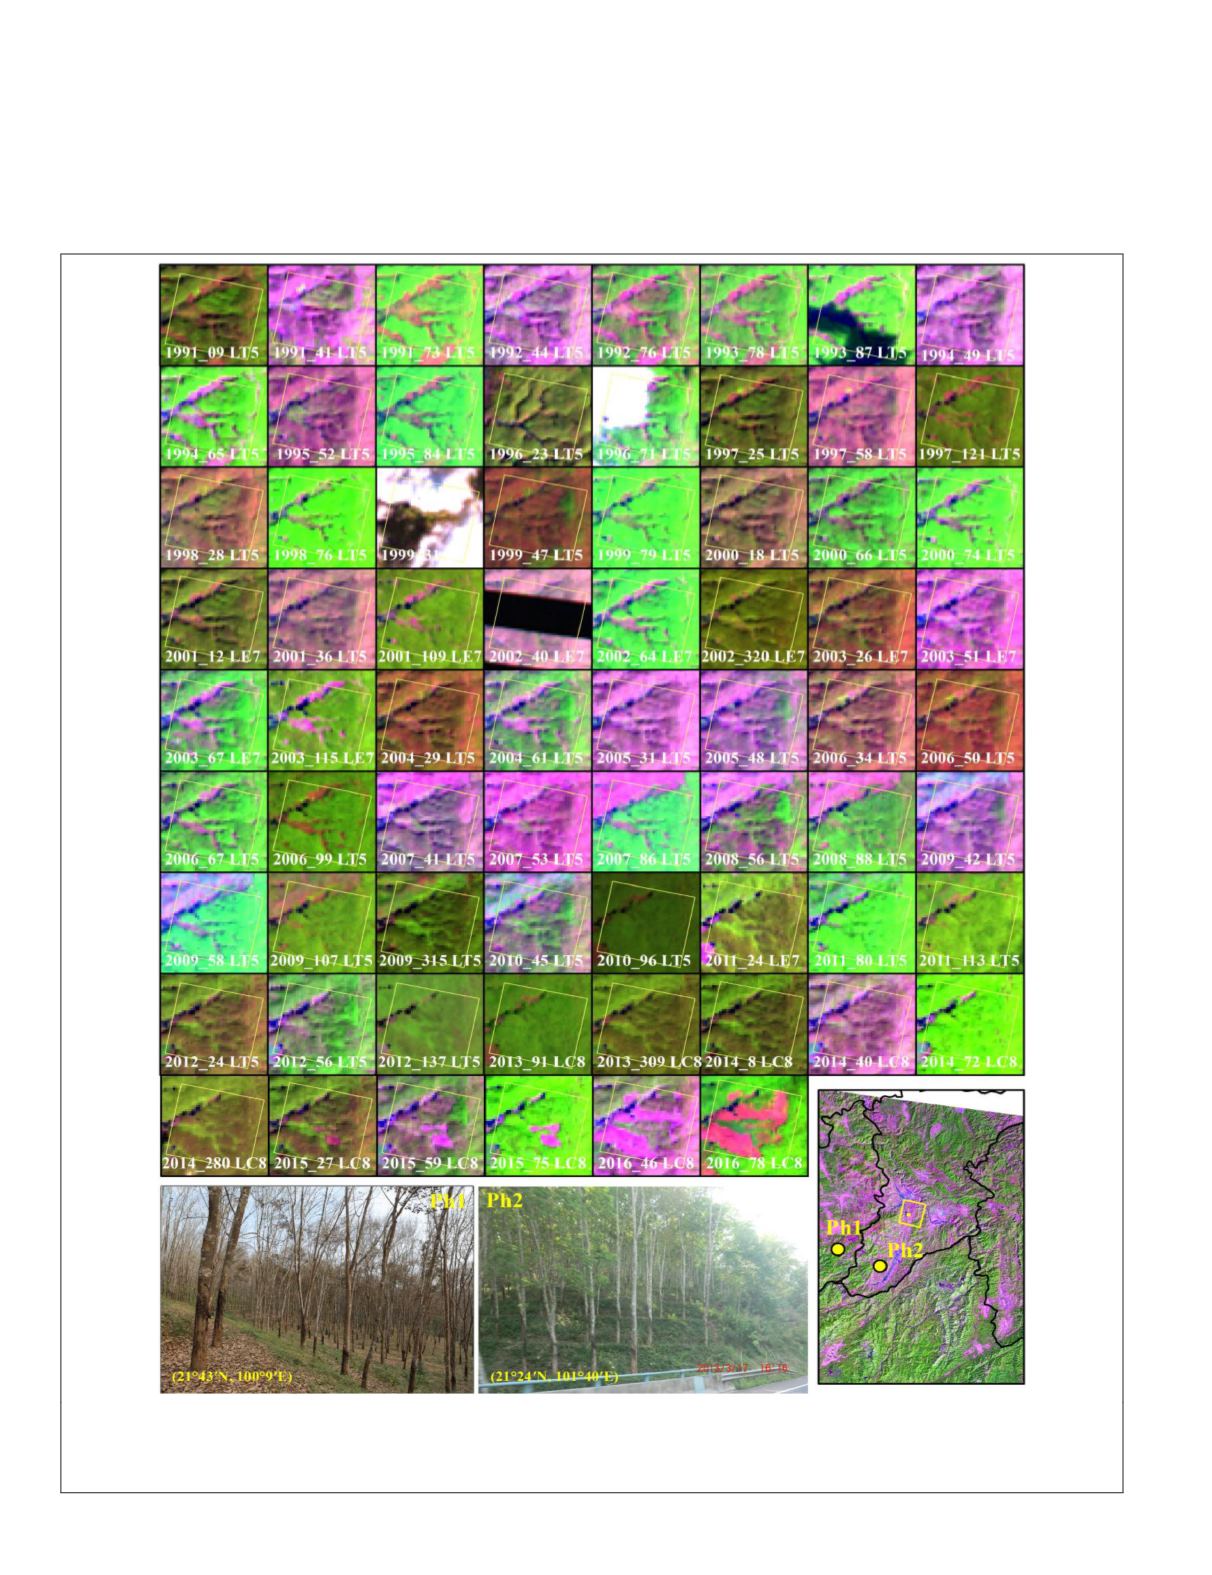
Figure 3. Imaging features of deciduous rubber plantations at various growth phases between 1991 and 2016. Two photos
taken on February 8, 2015, in Menghai County (Ph1) and March 17, 2013, in Jinghong City (Ph2) were used to illustrate
defoliation and foliation phases, respectively. The yellow inserted box illustrates landscape differences between deciduous
rubber plantations and natural evergreen forests.
690
September 2019
PHOTOGRAMMETRIC ENGINEERING & REMOTE SENSING


