results could also be optimized, which indicated the quality
of generated
DSM
could be converted to the task of image qual-
ity promotion.
Real Data Experiments
The previous subsection validated the feasibility and practicality
of the proposed method for subpixel generation. This subsection
focused on its effectiveness and usefulness on real image data.
Experiments Data
In this subsection, the image data from GeoEye satellite with
real image degradation relation were used to evaluate the pro-
posed method. Different from the simulated experiments, the
LR
stereo images used here were real images taken at the same
time with their counterpart
HR
images, rather than generated
from the original
HR
images. The images were taken in Cali-
fornia, United States, with 0.5 m resolution for
HR
images and
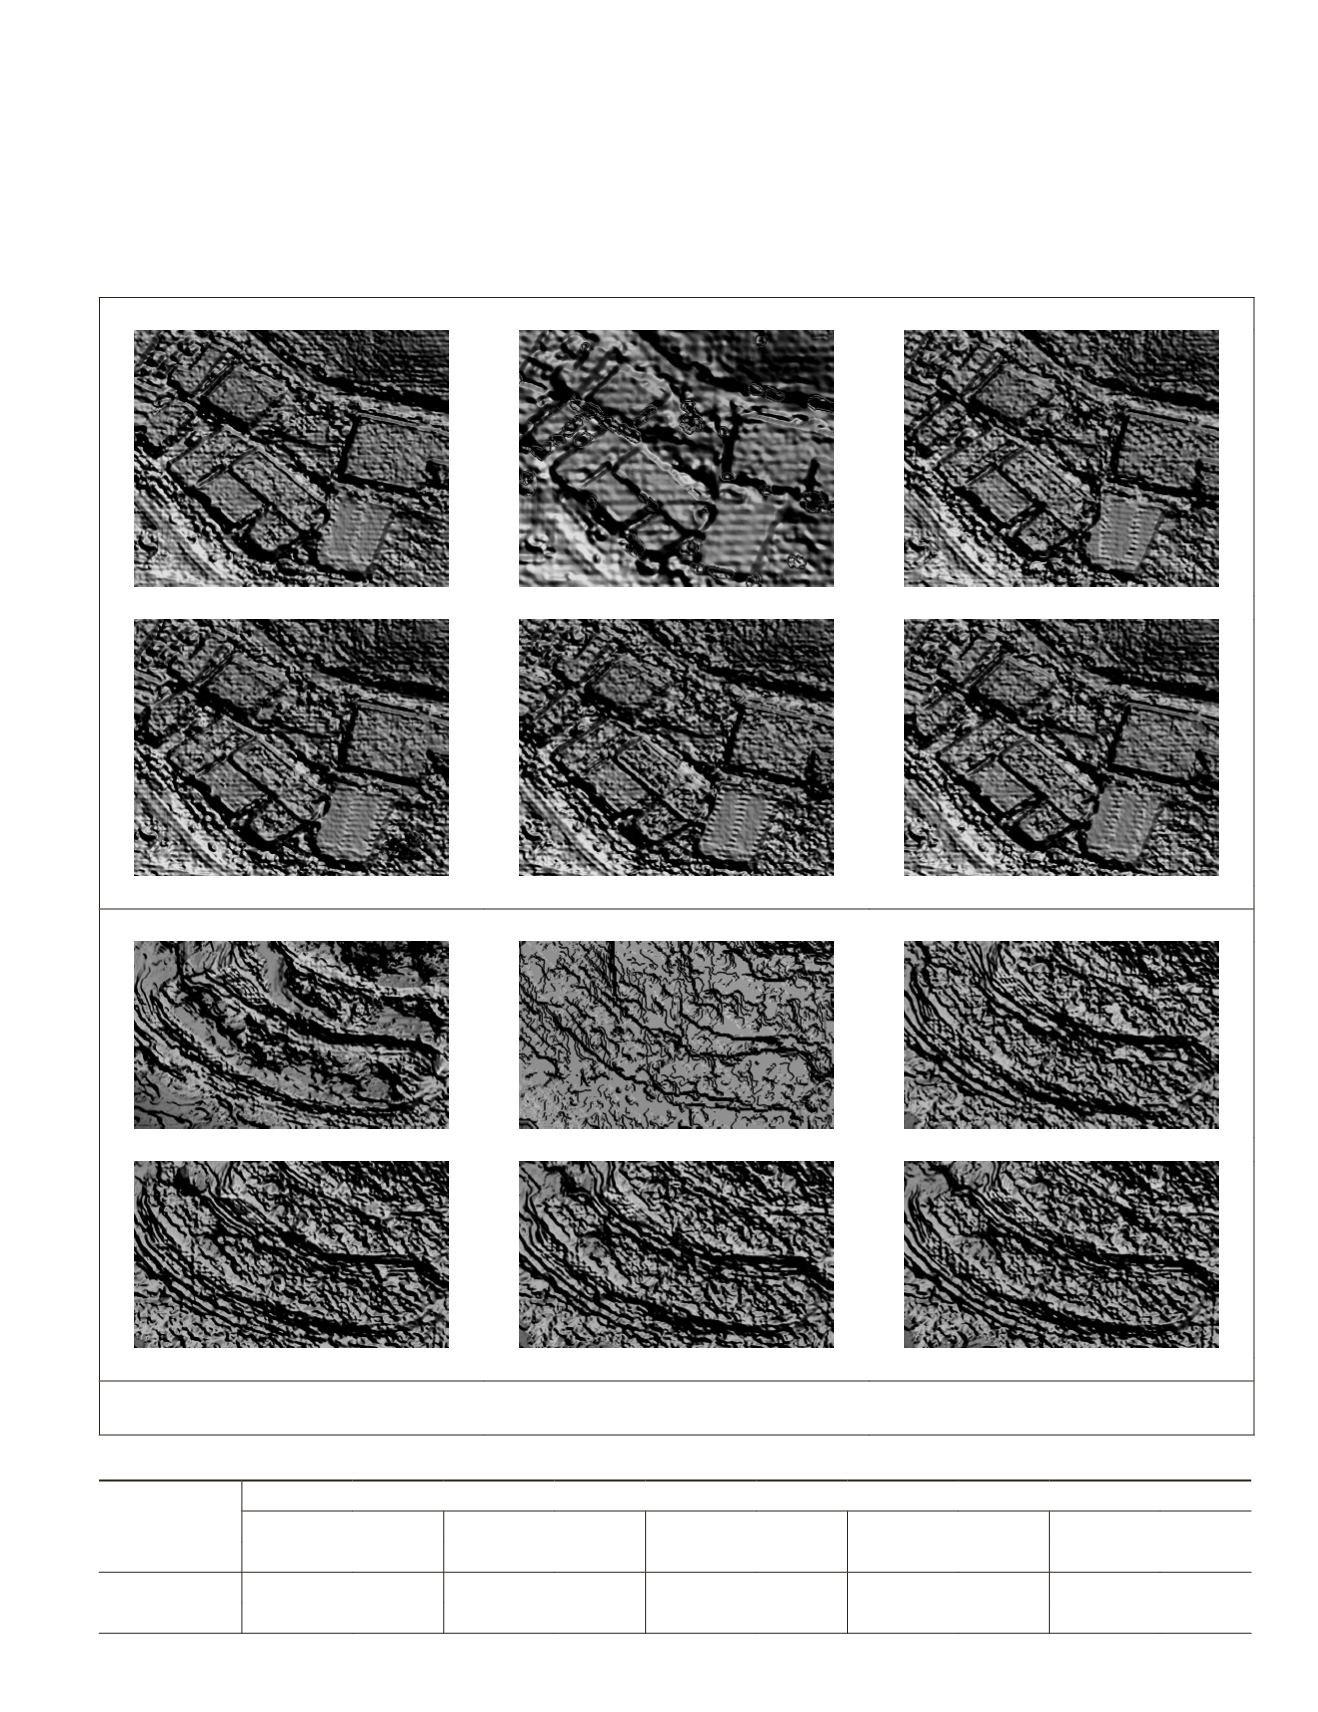
Reference
DSM UPSCALE
Bicubic
SRCNN
VDSR
SRMD
Region A: building area
Reference
DSM UPSCALE
Bicubic
SRCNN
VDSR
SRMD
Region B: non-building area
Figure 6. Visual comparison of reference
DSMs
and
DSMs
from different methods (region A is a building region; region B is a
forested and easy-mismatched region).
Table 4. Quantitative evaluation of reconstructed
DSMs
.
Regions
Methods
DSM UPSCALE
BICUBIC
SRCNN
VDSR
SRMD
RMSE(m)
MRE/% RMSE(m)
MRE/% RMSE(m)
MRE/% RMSE(m)
MRE/% RMSE(m)
MRE/%
A (550 * 674)
24.7955
1.74
2.7447
0.22
3.6123
0.23
1.2113
0.17
1.1252
0.13
B (396 * 666)
59.3723
4.43
58.5283
4.25
57.7189
4.08
55.5158
3.87
54.7113
3.79
PHOTOGRAMMETRIC ENGINEERING & REMOTE SENSING
October 2019
773


