Simulated Experiments
Experiments Data
To better validate the feasibility and practicality of this kind
of application, a series of simulated experiments were con-
ducted on World View stereo image dataset at first. The da-
taset was established with left images from WorldView1 and
right images from WorldView2, of which the spatial resolution
was 0.5 m. Besides, the geographical positioning accuracy of
the dataset was 4.1 m with circular error at 90% probability.
The testing site of this paper was located at Terrassa, Spain
which covered a semirural area at undulating terrain.
Experiments Details and Results
In this subsection, the
LR
images were downscaled from the
HR
images with bicubic down-sample. As more information
would be lost with a larger downscale factor and the main
purpose of the paper was for experimental validation, we just
set the downscale factor as 2 to conduct all the experiments.
Besides, as the super-resolved images had the same spatial
resolution and size with the original
HR
images, it was unnec-
essary to regenerate the
RPC
files in this subsection.
Under these conditions, the main experimental procedure
for subpixel
DSM
generation in this subsection was as follows:
the original
HR
stereo images were used to generate a reference
DSM
at first. Then, the downscaled images were super-resolved
with different
SR
models. The
DSMs
with super-resolved images
from different
SR
models were then generated. Moreover, to
further demonstrate the superiority of generating high-fidelity
subpixel level
DSM
, directly
DSM
upscale results were added as
extra comparison experiments, where the
LR DSMs
were firstly
generated with the downscaled image pairs and then interpo-
lated to the same resolution with the reconstructed
DSMs
.
Based on the consideration of time-consumption and
DSM
accuracy, a coarse-to-fine pyramidal
DSM
procedure was ad-
opted for generating a high accuracy
DSM
. In this process, with/
without the assistance of shuttle radar topography mission
(SRTM), the oriented super-resolved stereo images were used to
generate a relative low-resolution
DSM
at first, so that the eleva-
tion range of the main terrain in the site could be roughly deter-
mined. Then, with the guidance of the coarse
DSM
, a relatively
fine
DSM
could be obtained via repeating the dense matching
process. By iterating the coarse-to-fine step, a
DSM
which had
the same resolution as the
HR
images could finally be obtained.
In addition, a
DSM
refinement strategy was taken after each
coarse-to-fine step to further optimize the generated
DSM
.
It was worth noting that the spatial resolution of the finally
obtained
DSMs
were the same as the super-resolved images,
which was subpixel level compared to the
LR
images, there-
fore we regarded it as subpixel level
DSM
in this paper.
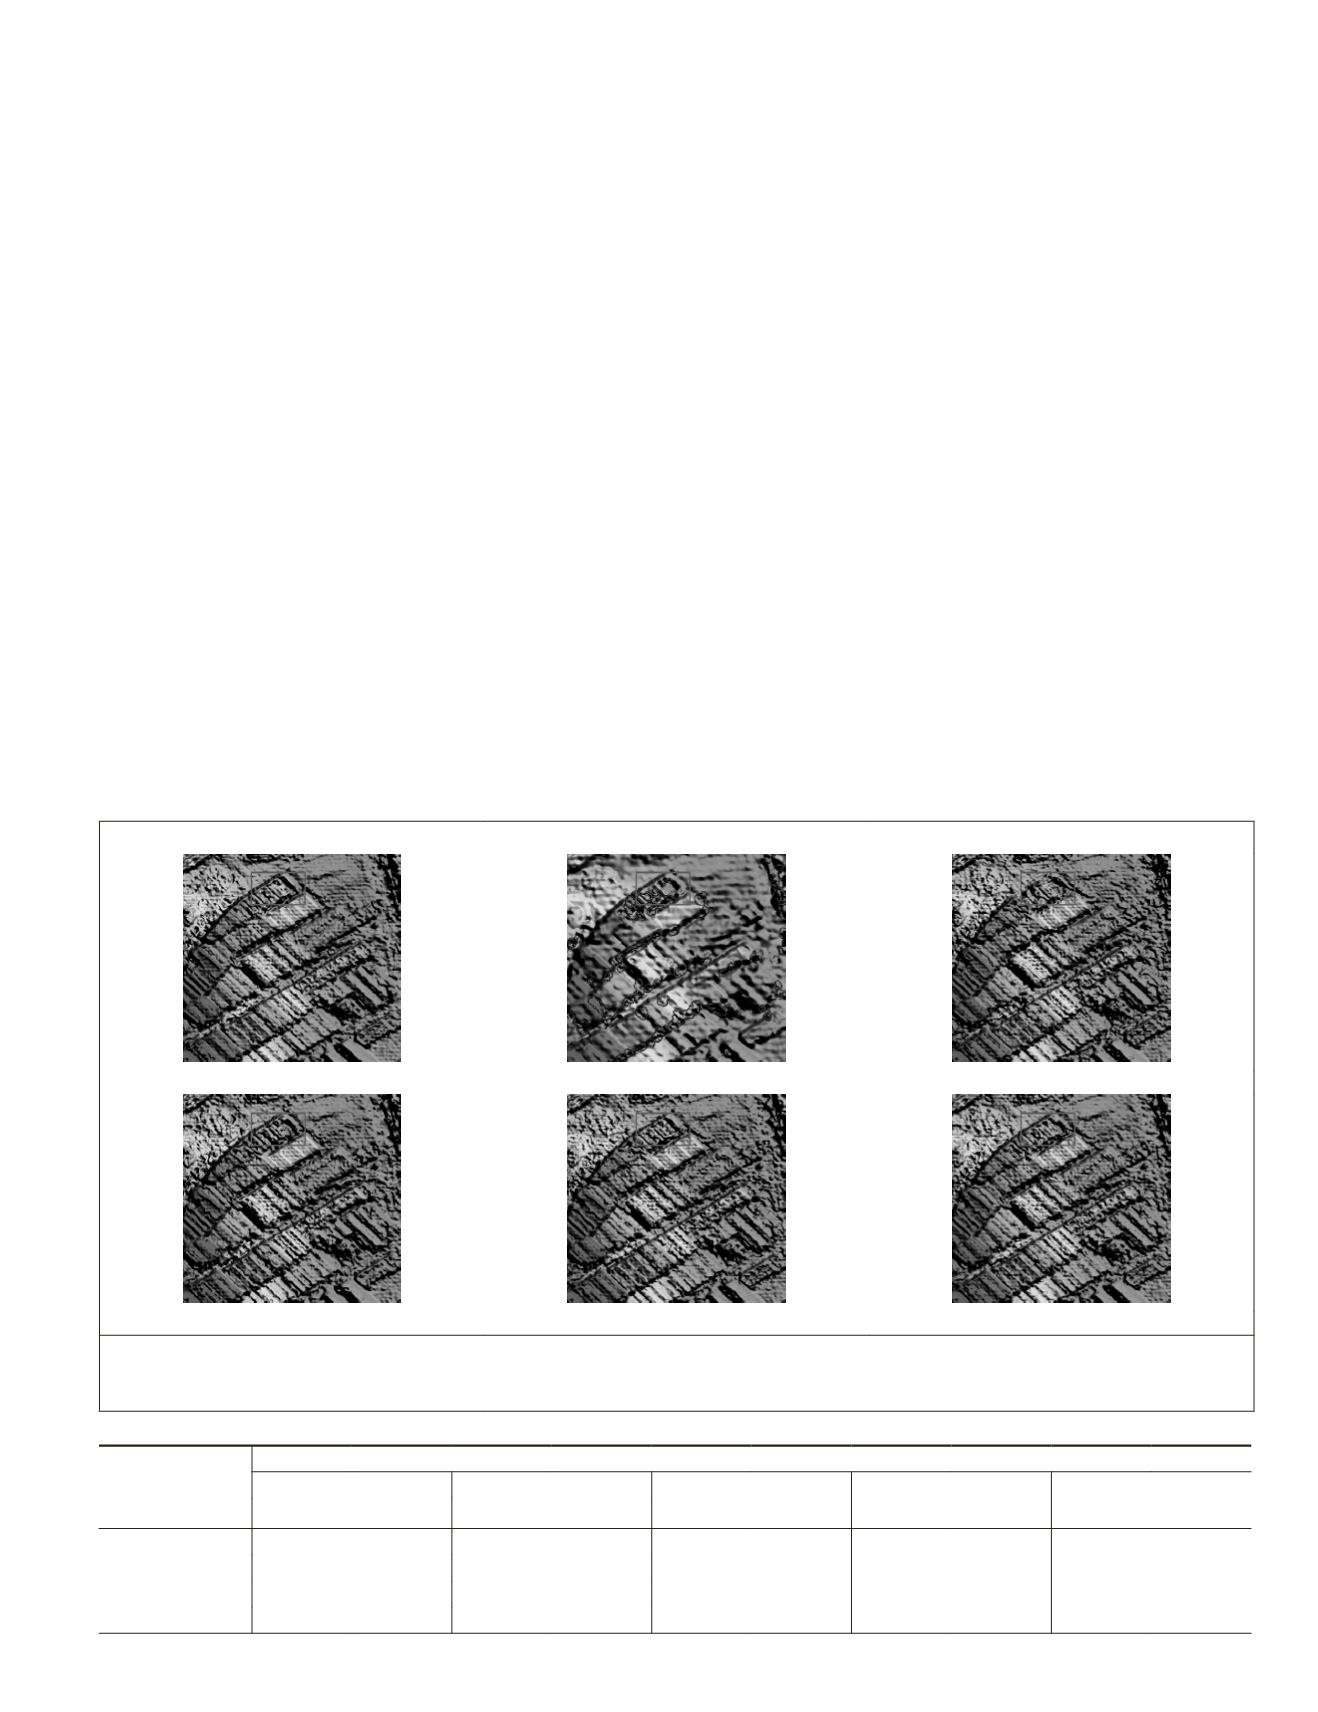
To show the performance of the application, four regions of
different terrains were selected to produce
DSMs
, whose spa-
tial resolution were 0.5 m. The generated
DSMs
were shown
in Figure 4, where the first
DSM
represented the reference
DSM
in each region, the second represented the
DSMs
from
LR DSM
upscale, and the others represented the
DSMs
generated with
different reconstructed
HR
images. Quantitative evaluation re-
sults for calculating deviation of these
DSMs
to their reference
DSM
were counted in Table 2.
Experiments Analysis
For the ease of illustration,
DSMs
generated from reference
HR
images were denoted as “Ref-
DSM
”.
DSMs
generated from
different super-resolved images were denoted as “Bi-
DSM
”,
Reference
DSM UPSCALE
Bicubic
SRCNN
SRMD
Region A: building area (the red box: the main difference area)
Figure 4. Comparison of generated
DSMs
from different methods in five regions of several different types of terrain. (Region
A is a building region, region B is a mountain region, region C is a main road region, and region D is a special region which
contained mismatch).
Continued on next two pages.
Table 2. Quantitative evaluation of reconstructed
DSMs
.
Regions
(region size)
Methods
DSM UPSCALE
BICUBIC
SRCNN
VDSR
SRMD
RMSE (m) MRE/% RMSE (m) MRE/% RMSE (m) MRE/% RMSE (m) MRE/% RMSE (m) MRE/%
A (604 * 634)
29.2777
2.64
1.2374
0.16
0.9455
0.14
0.7425
0.11
0.7249
0.08
B (892 * 806)
82.1113
6.36
87.9862
8.77
53.9941
3.79
46.4107
3.02
35.7335
1.91
C (895 * 671)
131.1828 13.46 118.8005 17.83 103.1256 11.43 84.3968
9.9
76.0433
6.45
D (1544 * 859)
53.4419
7.18
12.1617
1.35
12.1557
1.34
9.43
1.03
7.1771
0.71
PHOTOGRAMMETRIC ENGINEERING & REMOTE SENSING
October 2019
769


