Ground-truth data were collected by
on the same dates (i.e., 17 March 2010, 17 April 2010, and 26
April 2010) when the
SAR
images were acquired. A clustered
sampling approach was used to select field plots across land
cover classes (Congalton and Green 2009). This approach
maximizes the use of accessible sites in a poorly accessed
terrain. Weather conditions, soil moisture, and crop growth
parameters (e.g., plant height, stem diameter, and leaf area
index) were measured during the fieldwork. Only field plots
with a minimal change in these measurements were selected
to minimize the influence from the environmental change.
Following the suggestion based on the experience with multi-
nomial distribution (Congalton and Green 2009), a minimum
of 77 field plots were collected for each land cover class. By
interpreting the
SAR
image, we delineated these field plots
manually from the
SAR
images as the samples for land cover
classification. The sampling size ranged from 1200 pixels
to 2000 pixels, which were counted based on the
TerraSAR-X
image. Figure 2 demonstrates the distribution of the collected
samples in the study area. These samples were randomly
divided into two groups for training and validation. Table 2
shows the number of the samples selected for each land cover
class in the training and validation groups.
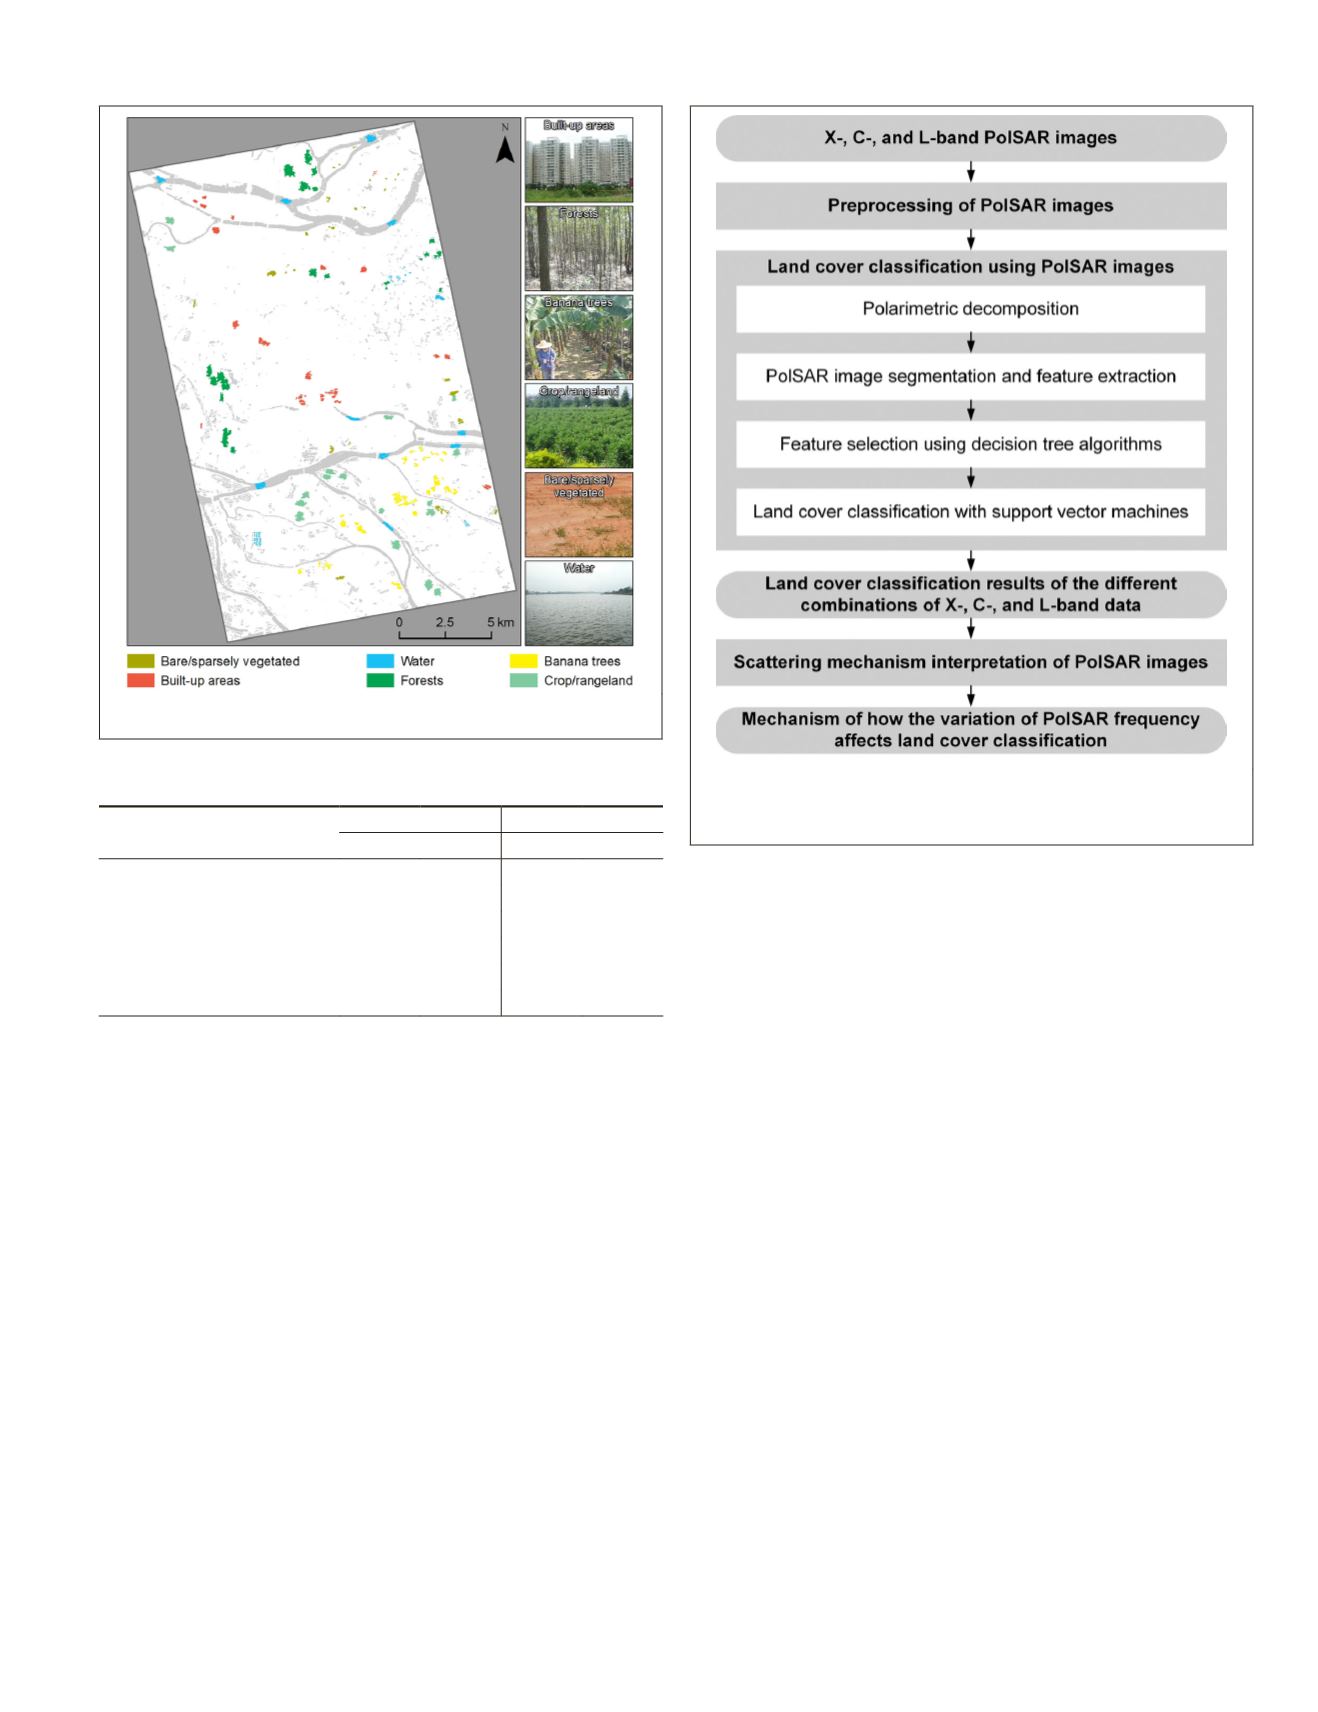
Methodology
The methodology consisted of three steps: (1) preprocess-
ing of
PolSAR
data, (2) land cover classification using
PolSAR
images, and (3) scattering mechanism interpretation of
PolSAR
images (Figure 3). In the second step, land cover classification
results of all the possible combinations of X-, C-, and L-band
ned and compared to show the differ-
capability between these combinations.
cattering mechanisms in the different
PolSAR
images were interpreted using polarimetric decomposi-
tion theorems to analyze how the frequency variation affects
the land cover classification.
Preprocessing of SAR Data
SAR
image preprocessing involved mainly radiometric calibra-
tion, speckle filtering, and geometric correction. The radio-
metric calibration aimed at converting the digital numbers
of
SAR
images to the backscattering coefficients, which is the
radar reflectivity per unit area in ground range. The radio-
metric calibration of the
TerraSAR-X
image was implemented
according to the following equation (Breit
et al.
2010):
C
= (
k
s
·
|
DN
|
2
–
NEBN
)
·
sin
θ
ioc
(1)
where
C
is the calibrated value,
k
s
is the calibration factor
given in the annotated files inside the
TerraSAR-X
product,
DN
is the digital number values,
NEBN
is the noise equivalent
beta naught, and
θ
ioc
is the local incidence angle.
The radiometric calibration of the
RADARSAT-2
product was
performed as follows (MacDonald, Dettwiler and Associates
Ltd 2016):
C
=|
DN
|
2
/
A
2
(2)
Figure 2. Samples collected for typical land cover classes in
the study area.
Table 2. Training and validation samples selected for each
land cover class.
Class
Training
Validation
Plots Pixels Plots Pixels
Built-up areas
158 192 120 158 194 221
Forests
247 398 450 247 364 208
Water
119 231 111 119 243 733
Crop/rangeland
150 306 737 149 320 278
Banana trees
121 216 309 121 217 806
Bare/sparsely vegetated land 77 121 505 78 108 341
Figure 3. Methodology for investigating the land cover
classification capabilities of the different combinations of
X-, C-, and L-band PolSAR data.
PHOTOGRAMMETRIC ENGINEERING & REMOTE SENSING
November 2019
801


