possesses a relatively weak penetration power. Consequently,
the C-band image obtained weaker double-bounce scattering
from forests and produced a larger double-bounce scattering
difference between forests and built-up areas than the L-band
image. Therefore, the combination of C- and L-band images
was superior to the sole use of L-band data in discriminating
built-up areas and forests (Figure 6c).
The combination of C- and L-band images achieved
higher user’s and producer’s accuracies for forests and crop/
rangeland than the sole use of C-band data (Figure 9). The
confusion between forests and crop/rangeland decreased by
84.98% with the addition of L-band data (Figure 10). Thus,
the user’s and producer’s accuracies for forests improved by
15.97% and 9.79%, respectively, and those for crop/rangeland
increased by 11.92% and 22.02%, respectively. The L- and
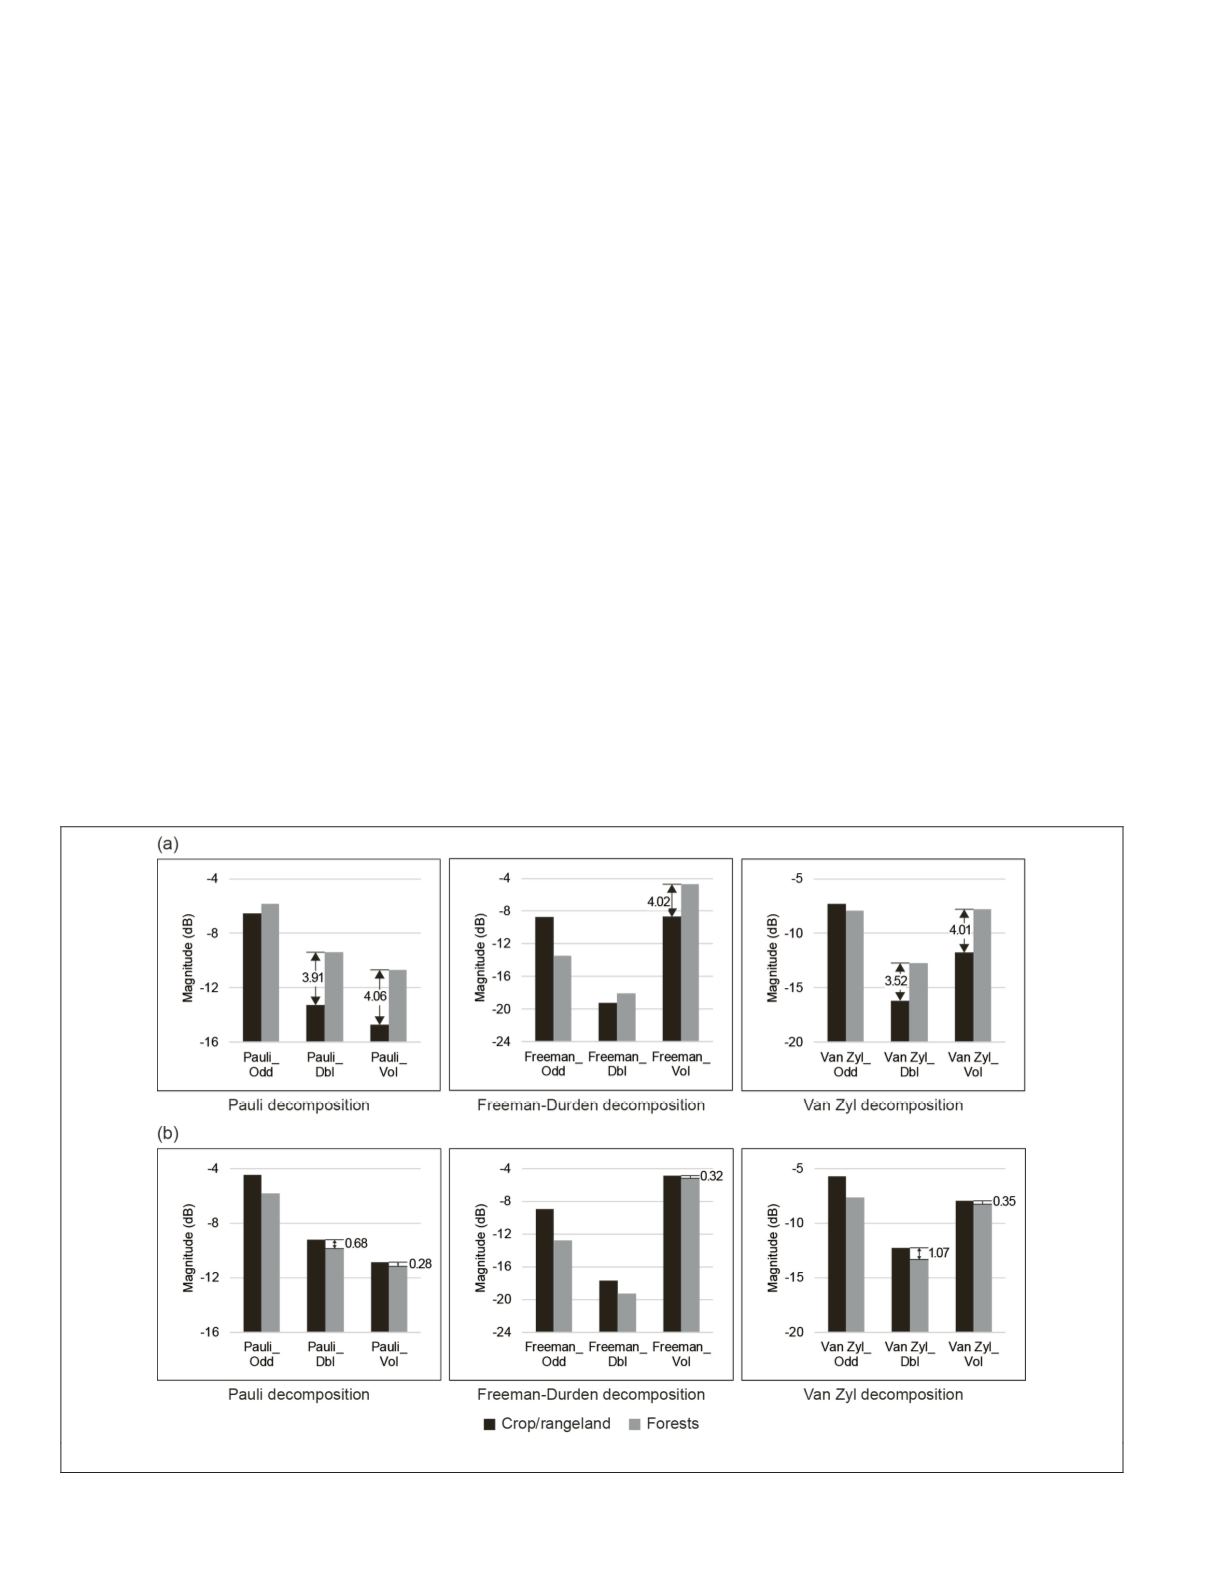
C-band images were compared for presenting the scattering
mechanism variations between crop/rangeland and forests
(Figure 15). The C-band radar signal interacted mainly with
the canopy layer of trees and resulted in a similar radar back-
scatter to that of crops, grasses, and shrubs given its relatively
weak penetration power. Forests were easily confused with
crop/rangeland in the C-band image (Figure 7a) because of the
small disparities in the scattering mechanisms (Figure 15b).
The L-band radar signal penetrated deeper into the tree cover
than the C-band radar signal for the volume scattering from
the entire canopy and the double-bounce scattering between
the trunks and ground. Forests produced much stronger vol-
ume and double-bounce scattering than crop/rangeland in the
L-band image given the large foliage and thick trunks (Figure
15a). Unlike the C-band image, the L-band image increased
the volume and double-bounce scattering differences between
crop/rangeland and forests by as much as 1,350.00% and
475.00%, respectively (Figure 15). Therefore, the addition of
L-band data was significantly helpful in distinguishing forests
and crop/rangeland (Figure 7a).
Compared with the sole use of C-band data, the combina-
tion of L- and C-band images also improved the user’s and
producer’s accuracies of banana trees by 7.16% and 2.43%,
respectively (Figure 9). The improvement resulted from the
decrease in the confusion of banana trees with crop/rangeland
and forests (Figure 10). Figure 16 demonstrates the compari-
son of radar backscatter between banana trees and crop/range-
land in the L- and C-band images. Banana trees yielded stron-
ger single- and double-bounce scattering than crop/rangeland
in both images, probably because of their large leaves and
thick trunks (Figure 2). The large leaves of banana trees could
form surface and dihedral reflectors that create strong single-
and double-bounce scatterings. The thick banana tree trunks
also contributed to the strong double-bounce scattering from
banana trees. The scattering mechanism differences between
banana trees and crop/rangeland were enhanced as the L-
band
SAR
fully interacted with the canopies and trunks of veg-
etation. Compared with the C-band image, the L-band image
increased the single- and double-bounce scattering differenc-
es between banana trees and crop/rangeland by as much as
56.21% and 52.05%, respectively (Figure 16). Therefore, the
combination of L- and C-band images performed slightly bet-
ter than the sole use of C-band data in discriminating banana
trees from crop/rangeland (Figure 7b).
Compared with the C-band image, the L-band image
increased the volume scattering difference between banana
trees and forests by as much as 1015.56% (Figure 17). Thus,
the combination of L- and C-band data reduced the confusion
between banana trees and forests by 84.23% in comparison
with the sole use of C-band data (Figure 10). The volume scat-
tering from vegetation is caused mainly by the crown layer.
The volume scattering from forests should be stronger than
that of banana trees because the crown layer of forests is typi-
cally larger and thicker than that of banana trees. However,
given its weak penetration power, the C-band radar interacted
Figure 15. Comparison of scattering mechanisms between forests and crop/rangeland in the (a) L-band image and (b) C-band image.
810
November 2019
PHOTOGRAMMETRIC ENGINEERING & REMOTE SENSING


