The primary benefit of acquiring
ALS
at a greater altitude or
aircraft speed, and therefore a lower pulse density, is de-
creased project costs (Jakubowski
et al
., 2013), although this
is potentially offset by a reduction in the accuracy of metric
retrieval. For example, decreasing pulse density reduces the
probability of intercepting crown apexes (Goodwin
et al
.,
2006) or over dense vegetation, decreases the probability of a
ground return (Takahashi
et al
., 2008). Other capture specifi-
cations altered by increasing flying height include increasing
laser footprint size which integrates the intercepted energy
over a larger area that in turn reduces instantaneous laser
power at the receiver. However, these factors are considered
less significant than sampling frequency (Goodwin
et al
.,
2006; van Leeuwen and Nieuwenhuis, 2010).
Although there are a number of studies that assess the
impact of reducing pulse density on the accuracy of metric
retrieval, these are generally limited to a single forest type or
small capture area (Gobakken and Næsset, 2008; Goodwin
et al
., 2006; Jakubowski
et al
., 2013; Magnusson
et al
., 2007;
Næsset, 2009; Takahashi
et al
., 2008). Previous studies have
concluded that for area-based attribution of vegetation struc-
ture, successful analysis can be achieved with a pulse density
between 0.5 to 1 pl m
-2
, even in mixed species multi-layered
forests (Hayashi
et al
., 2014). In this study we extend previous
work by assessing and comparing the direct retrieval of vegeta-
tion structure metrics from a broad range of forest types and
topographies across continental Australia: from open savan-
nah woodland to dense tropical forests (Figure 1). The focus of
this investigation is to assess the error and variance of veg-
etation structure metrics when captured at decreasing pulse
densities, as well as to estimate intra-plot variability and the
reproducibility of structural measurements from repeat cap-
ture. To facilitate metric estimation accuracy, a new technique
for the systematic thinning of point clouds is also introduced.
Method
Study Area and Data Capture
Six study areas, located across continental Australia (Figure
1), were selected from the Terrestrial Ecosystem Research
Network AusCover Facility. Study areas were selected to
capture a broad range of forest structure and types (Table 1
and Figure 2).
ALS
data (TERN/AusCover 2012) was acquired
between April 2012 to June 2013 for all areas by a single
provider (Airborne Research Australia) utilizing the same
capture specifications (Table 2) which facilitates comparison
between study areas. Flight lines followed a regular north-
south pattern spaced 125 m apart. This, in conjunction with
a maximum scan angle of ±22.5°, resulted in an approximate
swath overlap of 50 percent. Owing to steep terrain, addition-
al flight lines were required at two study areas (
WC
and
RC
).
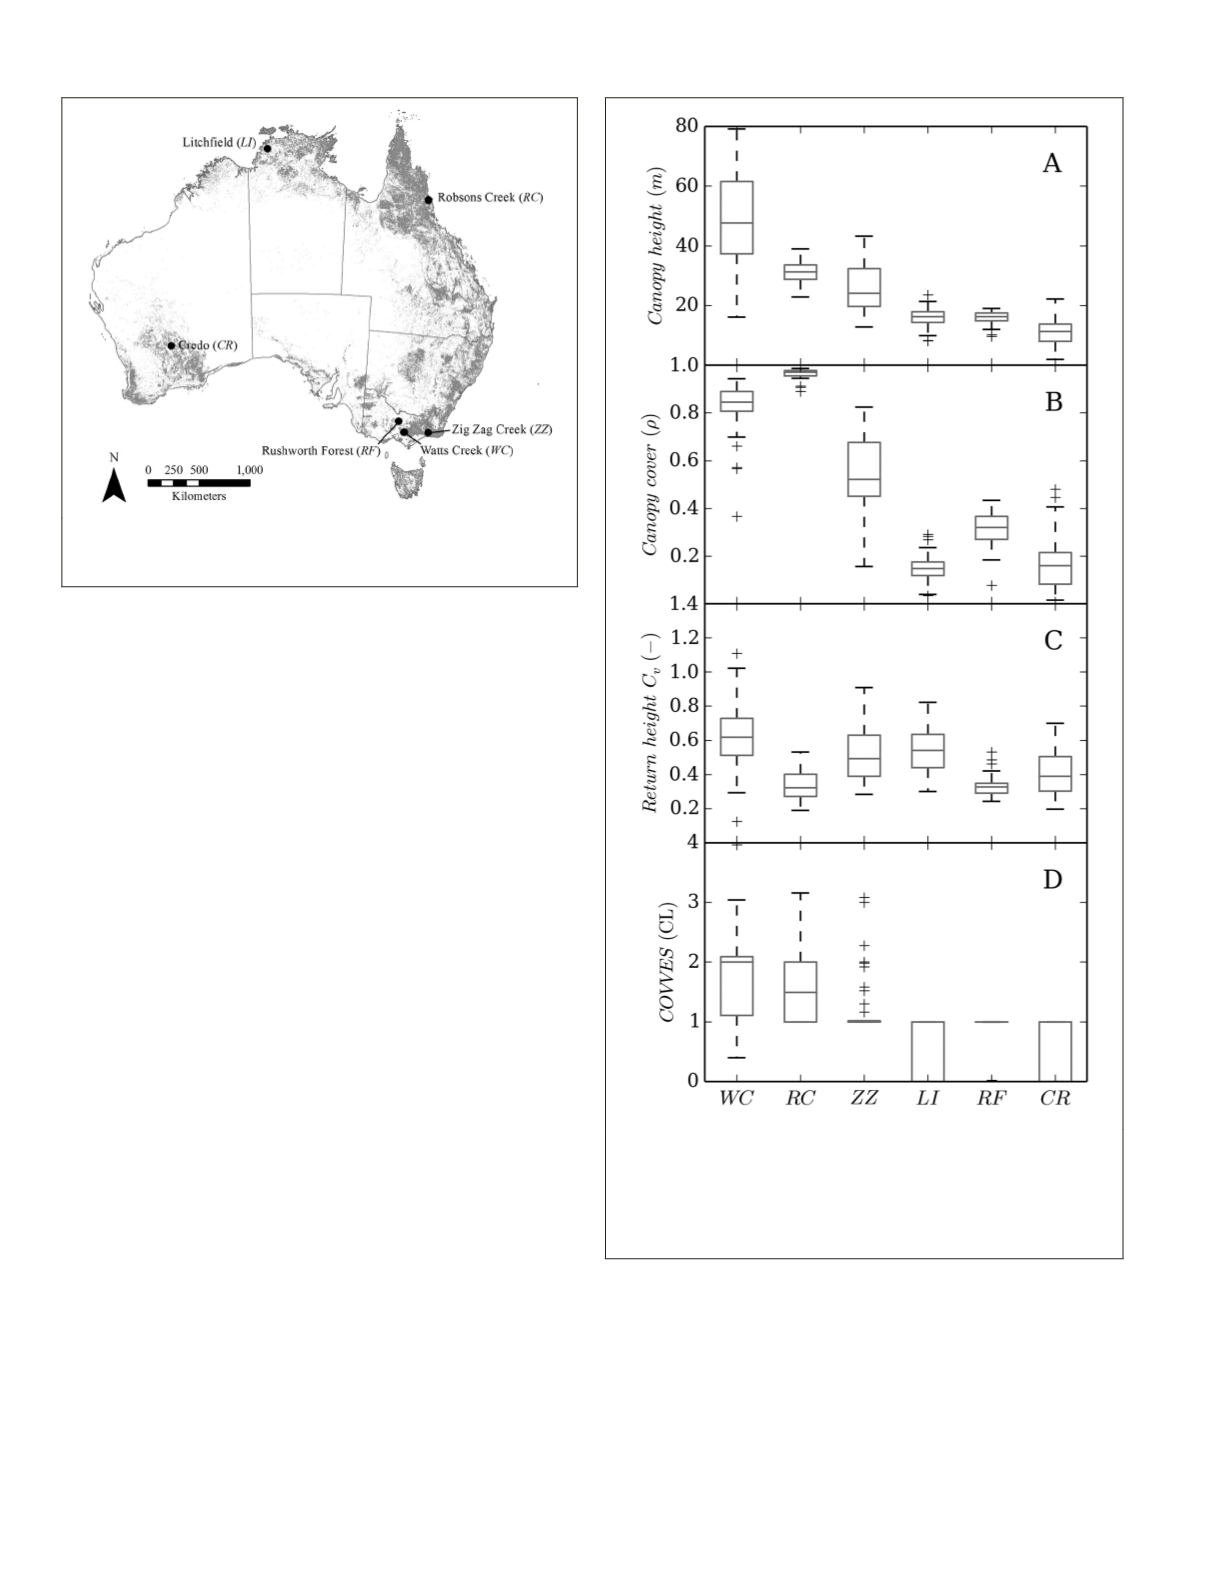
Figure 1. Map displaying the location of the six TERN sites used
in this investigation, shaded areas indicate forest extent (Mon-
treal Process Implementation Group for Australia, 2008).
Figure 2. Descriptive statistics for 4 metrics of canopy structure
across 6 study areas: (A) 95
th
percentile of canopy height. (B)
Proportion of cover calculated as 1 –
P
gap
(
z
) where
z
equals 1 m,
(C) Coefficient of variation (
C
v
) for non-ground return height and
(D)
COVVES
which estimates the number of canopy layers present
at each plot.
626
August 2015
PHOTOGRAMMETRIC ENGINEERING & REMOTE SENSING


