sparsely vegetated sites (
LI
and
CR
). For higher pulse densi-
ties (10 and 4 pl m
-2
) a reasonable identification of the ground
surface was achieved across all areas. As pulse densities de-
crease, the number of ground returns at the
RC
and
WC
areas
quickly diminishes. This is in contrast to areas where canopy
cover is less (Figure 2) where a regular grid of ground returns
is still clearly visible at 0.05 pl m
-2
.
Discussion
The 250 plots across six study areas used in this investigation
covered a broad spectrum of vegetation structure where cano-
py cover ranged from 2 to 98%, canopy height from 2 to 80 m,
and canopy structure ranged from shrub dominated through
to vertically complex systems (Figure 2). Yet for all vegetation
types, an asymptote in achievable accuracy is reached at a
pulse density of 0.5 pl m
-2
(Figures 4 and 5) when compared to
a high density acquisition. This suggests there is only marginal
improvement in achievable accuracy by capturing data at
higher densities for area based vegetation structure estimates.
Furthermore, intra-plot variance is captured at a pulse density
of 0.5 pl m
-2
, although small improvements are evident with
increasing pulse density (Figure 6). These results are compa-
rable to results found in similar studies (Goodwin
et al
., 2006;
Jakubowski
et al
., 2013; Treitz
et al
., 2012; Watt
et al
., 2013).
Structural measurements derived from pulse densities <0.5
pl m
-2
returned larger differences, particularly at the tropi-
cal rainforest (
RC
) study area which is attributed to a dense
canopy cover occluding the ground. Small overestimations of
ground height are common in forests where ground vegetation
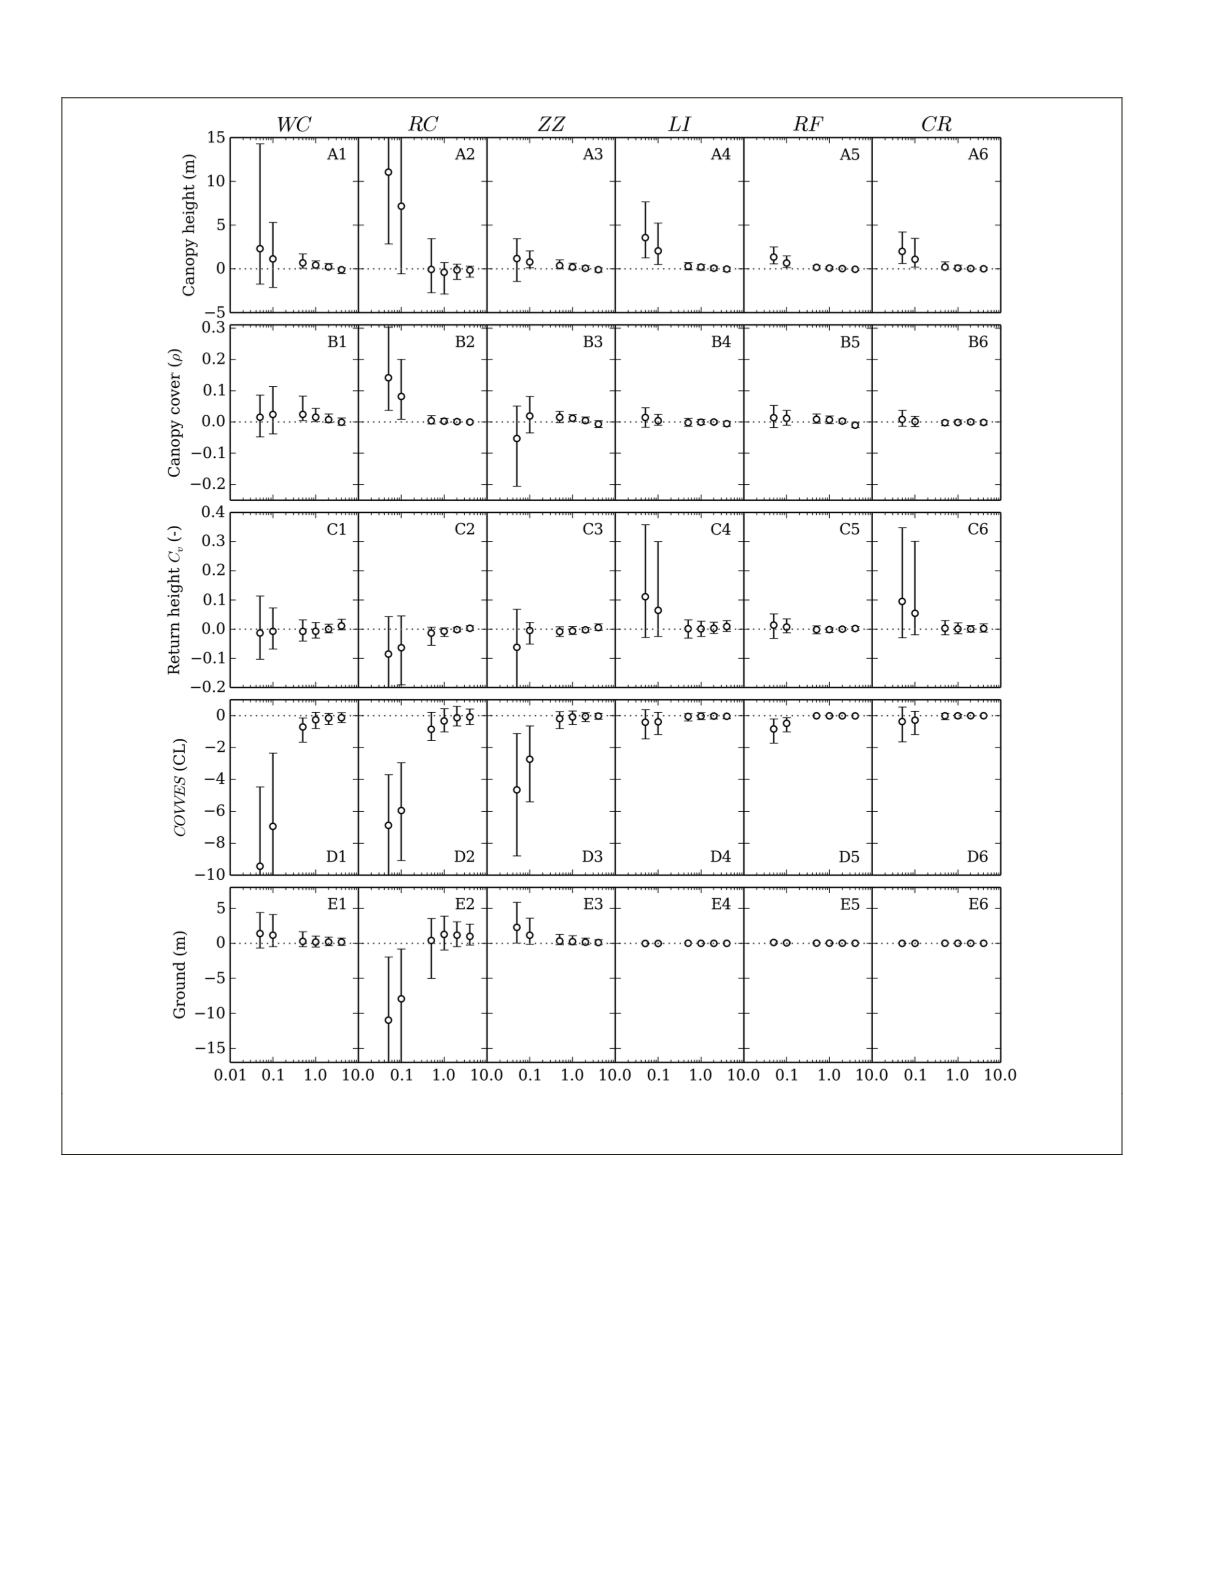
Figure 4. Difference between the plotwise mean value calculated at six pulse densities (0.05 to 4 pl m
-2
) and the value calculated at 10
pl m
-2
. Four metrics are used to summarize canopy structure: (A) canopy height, (B) canopy cover, (C) coefficient of variation (
C
v
) of return
height, and (D)
COVVES
. Additionally, difference in ground height is shown(E). Error bars represent the 95
th
percentile range.
630
August 2015
PHOTOGRAMMETRIC ENGINEERING & REMOTE SENSING


