vegetation cover is sparse and can therefore be underrepre-
sented in the
ALS
capture at lower pulse densities (Figure 4).
This effect is enhanced where vegetation cover is heteroge-
neous (e.g., clumped) as at the savannah and woodland areas.
Differences in canopy height estimates at diminishing
pulse densities are similar to those reported in studies over
different forest types. For example, when comparing different
flying heights Goodwin
et al
. (2006) found only small differ-
ences in the 99
th
percentile of canopy height (~1 m) estimated
at three pulse densities between ~0.5 and 1 pl m
-2
. Jakubowski
et al.
(2013) reported relatively large errors when using pre-
dictive models to estimate field derived canopy cover metrics.
Although this investigation does not compare results to field
estimates, it is suggested that the weighted 1 –
P
gap
(z) method
is robust to diminishing pulse density and could be used to
improve predictive models. Previous studies have suggested
that if sub-canopy structure is to be assessed satisfactorily
then higher pulse densities are required, however these stud-
ies have been mostly limited to
first-return
or
first-and-last-
return
captures (Jakubowski
et al
., 2013; Thomas
et al
., 2006).
The inclusion of intermediate returns suggest that the canopy
profile can be satisfactorily attributed at 0.5 pl m
-2
when com-
pared to more dense acquisition (Figure 4 C and D). Observed
patterns of increasing variance with decreasing pulse density
are similar for the four metrics tested and to trends reported
in previous studies (Gobakken and Næsset, 2008). Random
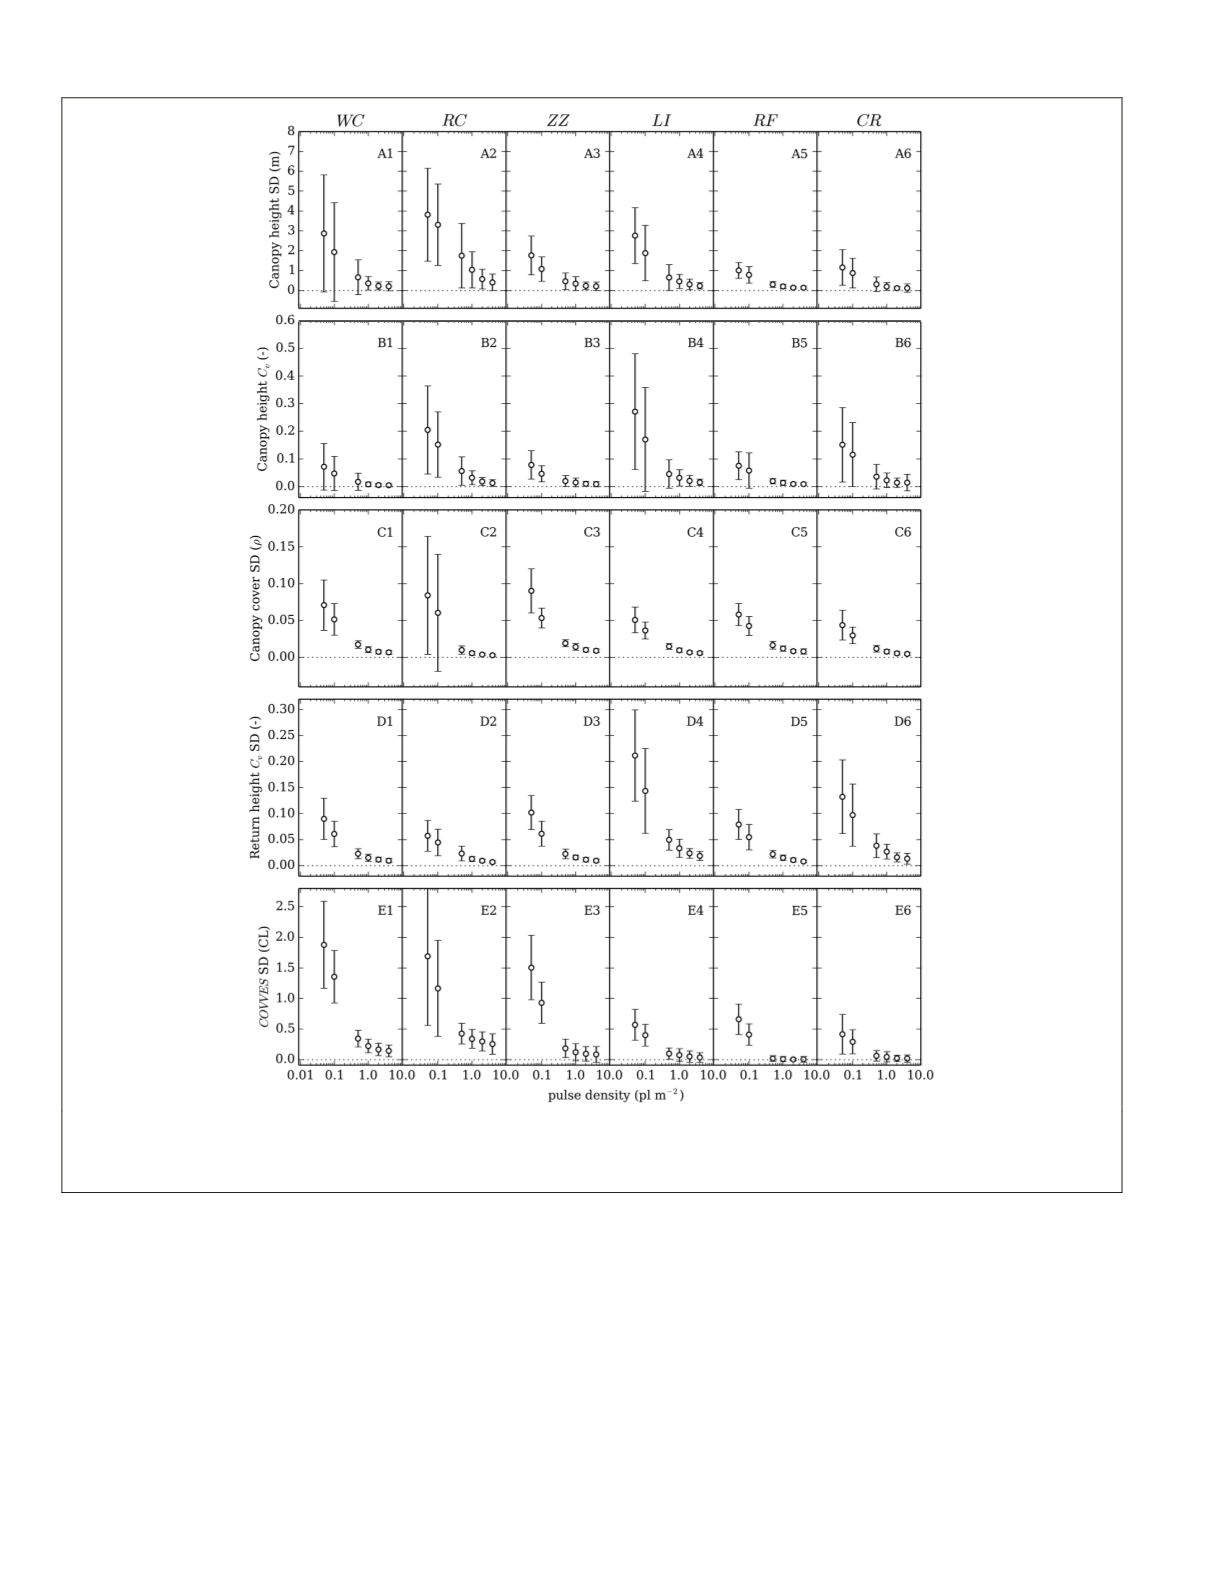
Figure 6. Mean intra-plot variance for vegetation structure metrics where variance is calculated as the standard deviation of nine realiza-
tions drawn systematically from the original dataset. Four metrics were computed: (A) canopy height, (C) canopy cover, (D) coefficient
of variation (
C
v
) of return height, and (E)
COVVES
. Additionally, (B)
C
v
of canopy height was included, which normalizes for canopy height
when calculating variance. Error bars represent standard deviation of mean variance.
632
August 2015
PHOTOGRAMMETRIC ENGINEERING & REMOTE SENSING


