proper point. Although automated algorithms, such as Itera-
tive Closest Point (
ICP
) patch matching or plane and line fits,
can be used to try and overcome the lidar sampling issue when
measuring points; even these measurement techniques present
mensuration uncertainties that must be included in an accu-
racy analysis. Vertical mensuration error for the experiment
was assumed to be zero since the check points were associated
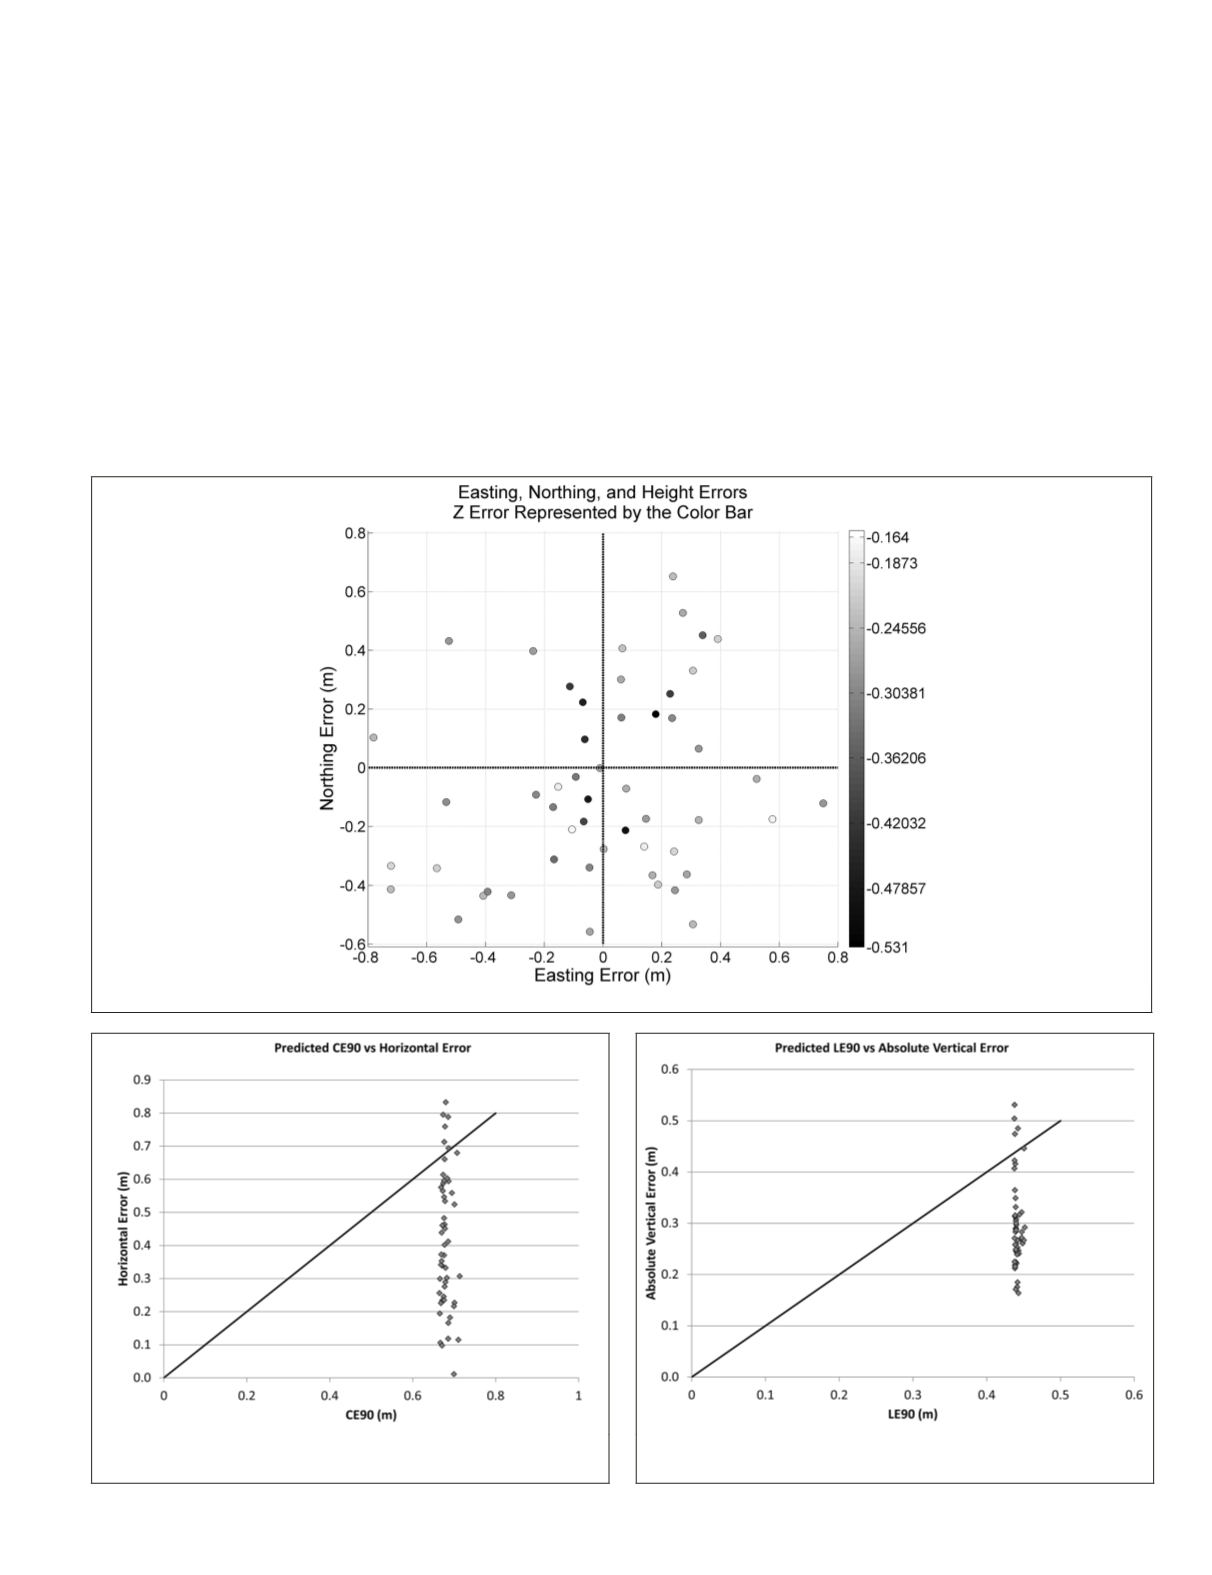
with nearby flat areas. Also calculated were the true errors in
the mensurated points by subtracting the survey checkpoint
coordinates from the mensurated coordinates (Figure 7).
A test was performed to ensure the checkpoint accuracies
did not significantly influence the
ULEM
-derived predictions.
The checkpoint uncertainties were root-sum-squared with
the
ULEM
predicted uncertainties prior to the CE90 and LE90
computations. Results of this test showed no significant effect
upon the
ULEM
-derived predictions.
Figure 8 plots the
ULEM
-predicted
CE
90 values against
the true horizontal errors for the 52 mensurated points. The
45-degree line indicates where the predicted uncertainties
would equal the true errors. Since a 90
th
percentile value is
used, 90 percent of the points should fall below the line if
the uncertainty estimates are correct. In this plot, 46 of the 52
points (88.5 percent) fall below the line.
Figure 9 plots the
ULEM
-predicted
LE
90 values against the
absolute true vertical error for the 52 mensurated points. Again,
the 45-degree line indicates predicted uncertainty equal to true
error, and 90 percent of the points should fall below the line. In
this plot, 48 of the 52 points (92.3 percent) fall below the line.
This experiment tested an end-to-end
ULEM
workflow going
from data collection, to
ULEM
generation, to data exploitation.
While a full 90 percent passing was not achieved for the
CE
90,
both the
CE
90 and
LE
90 provided acceptable results based on
the input sample size. More importantly, it shows a successful
implementation of the
ULEM
concepts to include the storage and
use of the error data in compliance with a standard (
LAS
) format.
Figure 8. Comparison of Predicted Horizontal Uncertainty vs. True
Horizontal Error.
Figure 9. Comparison of Predicted Vertical Uncertainty vs. Abso-
lute True Vertical Error.
Figure 7. Measured Horizontal and Vertical Errors.
PHOTOGRAMMETRIC ENGINEERING & REMOTE SENSING
July 2015
555


