April and September and the pronounced
NPP
of desert steppe
in the span May-August.
The monthly
NPP
of Mongolia revealed a spatial pattern
that has close similarity to geographical distribution of the
terrestrial ecosystems in the country. In the view of seasonal
trend through the years, the mean of monthly
NPP
of the ter-
restrial ecosystems behaved as a parabolic curve or inverse
U-shape in the growing season of a year. This temporal pat-
tern, which starts in April, peaks in June or July, and ends in
October, was relatively stable in each terrestrial ecosystem
and repeatable interannually.
In contrast to the mean of monthly
NPP
s, the increment
of
NPP
in a succession of six growing periods from 2000 to
2004 has shown three kinds of spatial patterns in which
their positively and negatively significant growth and stably
insignificant growth occurred in accordance with spatial and
temporal variations. The derived common features of the
NPP
growth in Mongolia were a major positive growth which oc-
curred initially at the early stage of growing season, then an
insignificant stable growth became dominant in the middle of
the growing season, and finally negative growth turned out to
be in the majority during the late stage of the growing season.
Mongolia has typical continental climate. The mean aver-
age of monthly terrestrial ecosystems’
NPP
was positively
related to the monthly average temperature and precipitation
during the growing season in Mongolia. This relationship is
similar to the one of the continental humid climate region
such as New England in
USA
and the subtropical humid cli-
mate region such as Guizhou in China. More specifically, the
mean average of monthly
NPP
s of the forest, grassland, desert
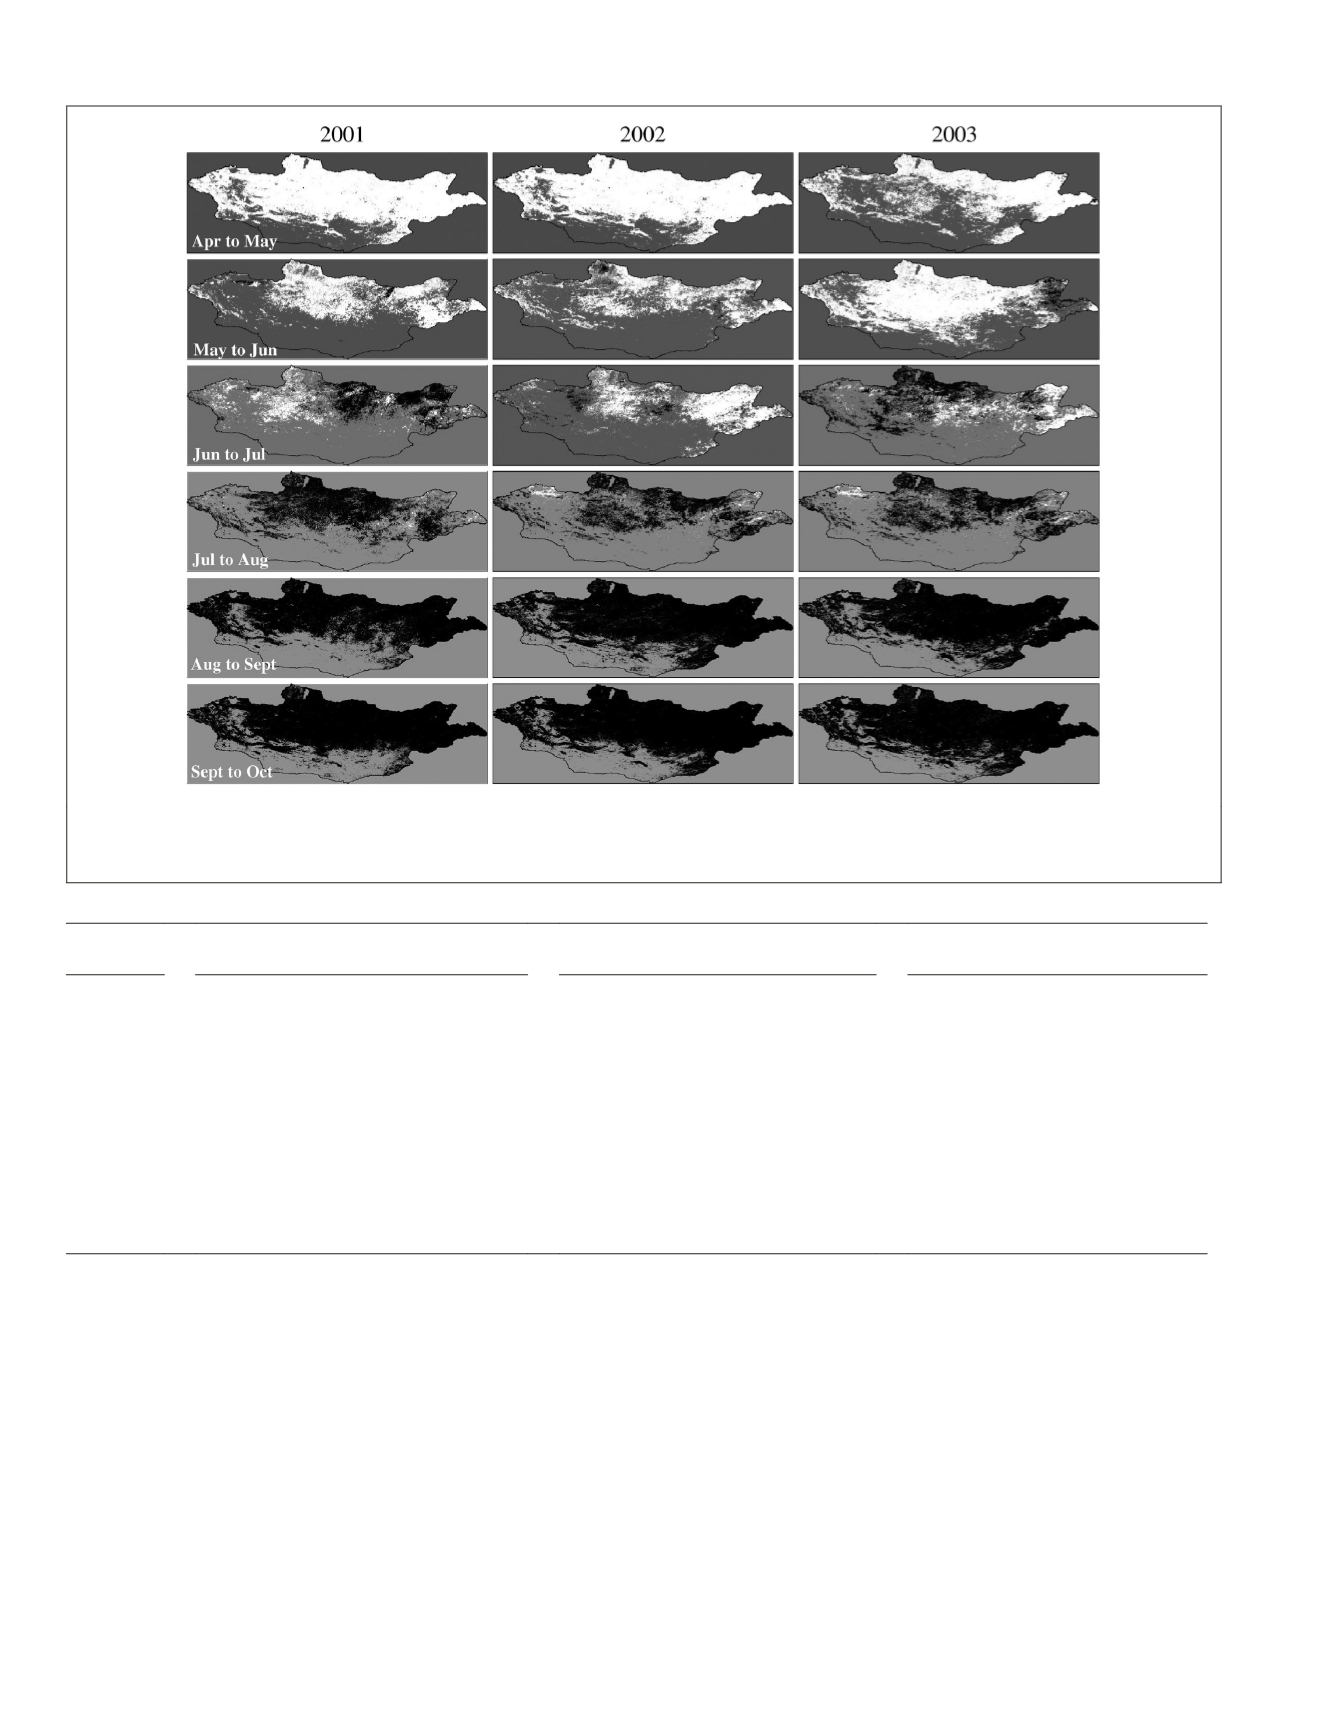
Figure 7. Spatiotemporal patterns of the increment of
npp
in Mongolia. The growth of monthly
npp
(gC m
–2
mo
–1
) are presented with white
and black according to whether the increment is positively or negatively significant, respectively. The insignificant increment (stable
growth) is presented in grey color.
T
able
4. T
emporally
S
patial
F
eatures
of
M
ongolian
NPP G
rowth
in
2000
to
2004
Months
Duration
Pattern 1
(2000, 2001)
Pattern 2
(2002 and 2004)
Pattern 3
(2003)
April- May
Dominant PG in the Center / North of
the country.
Dominant PG around the center and
North (similar to Pattern 1).
PG or IG evenly distributed over
the whole country.
May- June
Some PG keeps mainly in the North.
Mainly widely distributed IG.
Some PG in the North. Mainly
widely distributed IG.
PG dominant in the Center /
North. Some IG in the South.
June- July
Little PG in North / NW, some NG in
NE. Widespread IG.
Partial PG in center and East. Mainly
dominant IG with some NG in the
North and West
PG continues partially and spreads
East. Some NG in center / North.
Mainly IG elsewhere.
July- Aug
Little PG with large area of NG in the
North. IG dominant in the South.
Little PG. Dramatic NG in the North.
IG dominant in the South.
Little PG. Increasing NG in center
/ North. IG is dominant.
Aug- Oct
NG dominant in the middle-north and
then spreads widely over the country
NG dominant North to South. IG co-
dominant South.
NG dominant in the North then
spreads widely over the country
596
July 2015
PHOTOGRAMMETRIC ENGINEERING & REMOTE SENSING


