minimum significant difference (
MSD
) between any two
values of monthly
NPP
was conservatively suggested 8.62
(gC m
–2
mo
–1
). The
NPP
increment (or growth) in a time span
(a period from time 1 to time 2) can be defined as the differ-
ence of
NPP
for any two adjacent months in a year, i.e.,
D
NPP
=
NPP
t2
-
NPP
t1
. The value of
MSD
therefore could be applied to
evaluate whether a
NPP
growth is statistically meaningful;
specifically, a significantly positive growth (
PG
) will be coded
as 1 if
Δ
NPP
≥
MSD
, a significantly negative growth (
NG
) will be
coded as -1 if
Δ
NPP
<–
MSD
, and an insignificant growth (
IG
)
will be coded as 0 when –
MSD
<
Δ
NPP
<
MSD
indicating an stable
growth. There are three kinds of spatiotemporal patterns that
can be identified in the sequential images of
NPP
growth in
Mongolia in the years from 2000 to 2004. Representatives of
the spatiotemporal patterns can be seen in Figure 7. Briefly, a
major positive growth happened in the early growing season, a
pronounced insignificantly stable growth was seen during the
middle growing season, and a major negative growth occurred
in the late growing season. Detail of the
NPP
growth patterns
are shown in Table 4.
Seasonal Trend of Percentage Area of Positive and Negative NPP Growth
In Figure 8, the percentage area of the significantly positive
and negative growth (
PASPG
and
PASNG
) of Mongolia terrestrial
ecosystems changed following a nonlinear trend throughout
the time spans of the growing season.
PASPG
in the first span
April to May (coded as AtoM) was the largest during the grow-
ing season; it ranged from 52 to 78 percent among the years
2000 to 2004. In the second span May to June (coded as MtoJ),
PASPG reduced in percentage to between 28 to 57 percent, and
then reduced continuously during the subsequent time spans.
The pronounced raise in 2003 has shown that the PASPG
during the time span May to June differs obviously from the
decreased trends in the other years. This phenomenon indi-
cates that the
NPP
growth in 2003 did not behave according to
the general trend and also reflects the abnormal precipitation
in 2003 that has been shown in Figure 7. On average, the five-
years-based
PASPG
was around 66, 36, 16, 2, 0, and 0 percent
for the six time spans of the growing season, respectively. A
very small amount of
PASNG
started during the second span
May to June, then it increased around 3 to 18 percent during
the third span, June to July (coded as
JtoJ
); after that,
PASNG
at
the spans July to August (
JtoA
), August to September (AtoS),
and September to October (
StoO
) increased sharply. In general,
the five-years-based
PASNG
raised sharply from 0, 2, 11, 43, 70,
and 77 percent during the six time spans, respectively.
Using the time span
x
as a regressor, where
x
= {1, 2, …, 6}
represents the span April-May, May-June, June-July, July-
August, August-September, and September-October, the value
of PASPG and PASNG in the growing season could be well ex-
plained by sigmoid function. PASPG followed a declining non-
linear trend while in contrast PASNG varied like an increasing
trend of a nonlinear curve. The slope of the fitted sigmoid model
was -0.7518 and 0.5002 for PASPG (Equation 9) and PASNG
(Equation 10) indicating that the percentage area of positive
growth changed more sharply in a relatively shorter period of
time than that of negative growth during the growing season.
y
= 92.1618/(1+exp(–(
x
–1.6954)/–0.7518)),
R
2
=0.9301, SE(y)=6.9481.
(9)
y
= 77.7217/(1+exp(–(
x
–3.9075)/0.5002)),
R
2
=0.9627, SE(y)=6.5135.
(10)
Conclusions
This study explored the spatial and temporal patterns of
NPP
of Mongolia over a five-year duration. Annual
NPP
of the
whole area of Mongolia was around 0.71 PgC yr
–1
, which
was mainly produced in the period from May to August,
then April and September, and finally October. Although the
nationwide annual
NPP
appeared to exhibit a trend of continu-
ously slight decrease from 2000 to 2003 and then a rise to the
level of 2001 in the following year, the difference among the
nationwide annual
NPP
in 2000 to 2004 was statistically insig-
nificant. For specific type of terrestrial ecosystems in Mongo-
lia, forest whose average monthly
NPP
(110 gC m
–2
mo
–1
) in the
growing season was the largest; compared to grassland, desert
steppe, and desert; the productivity of these four terrestrial
ecosystems was in the relative ratio of 4.1 : 2.5 : 1.7 : 1.0. The
highest
NPP
of the grassland in June and July was almost equal
to the forest’s
NPP
in April and September. The lowest
NPP
of
the forest in October was very close to the
NPP
of grassland in
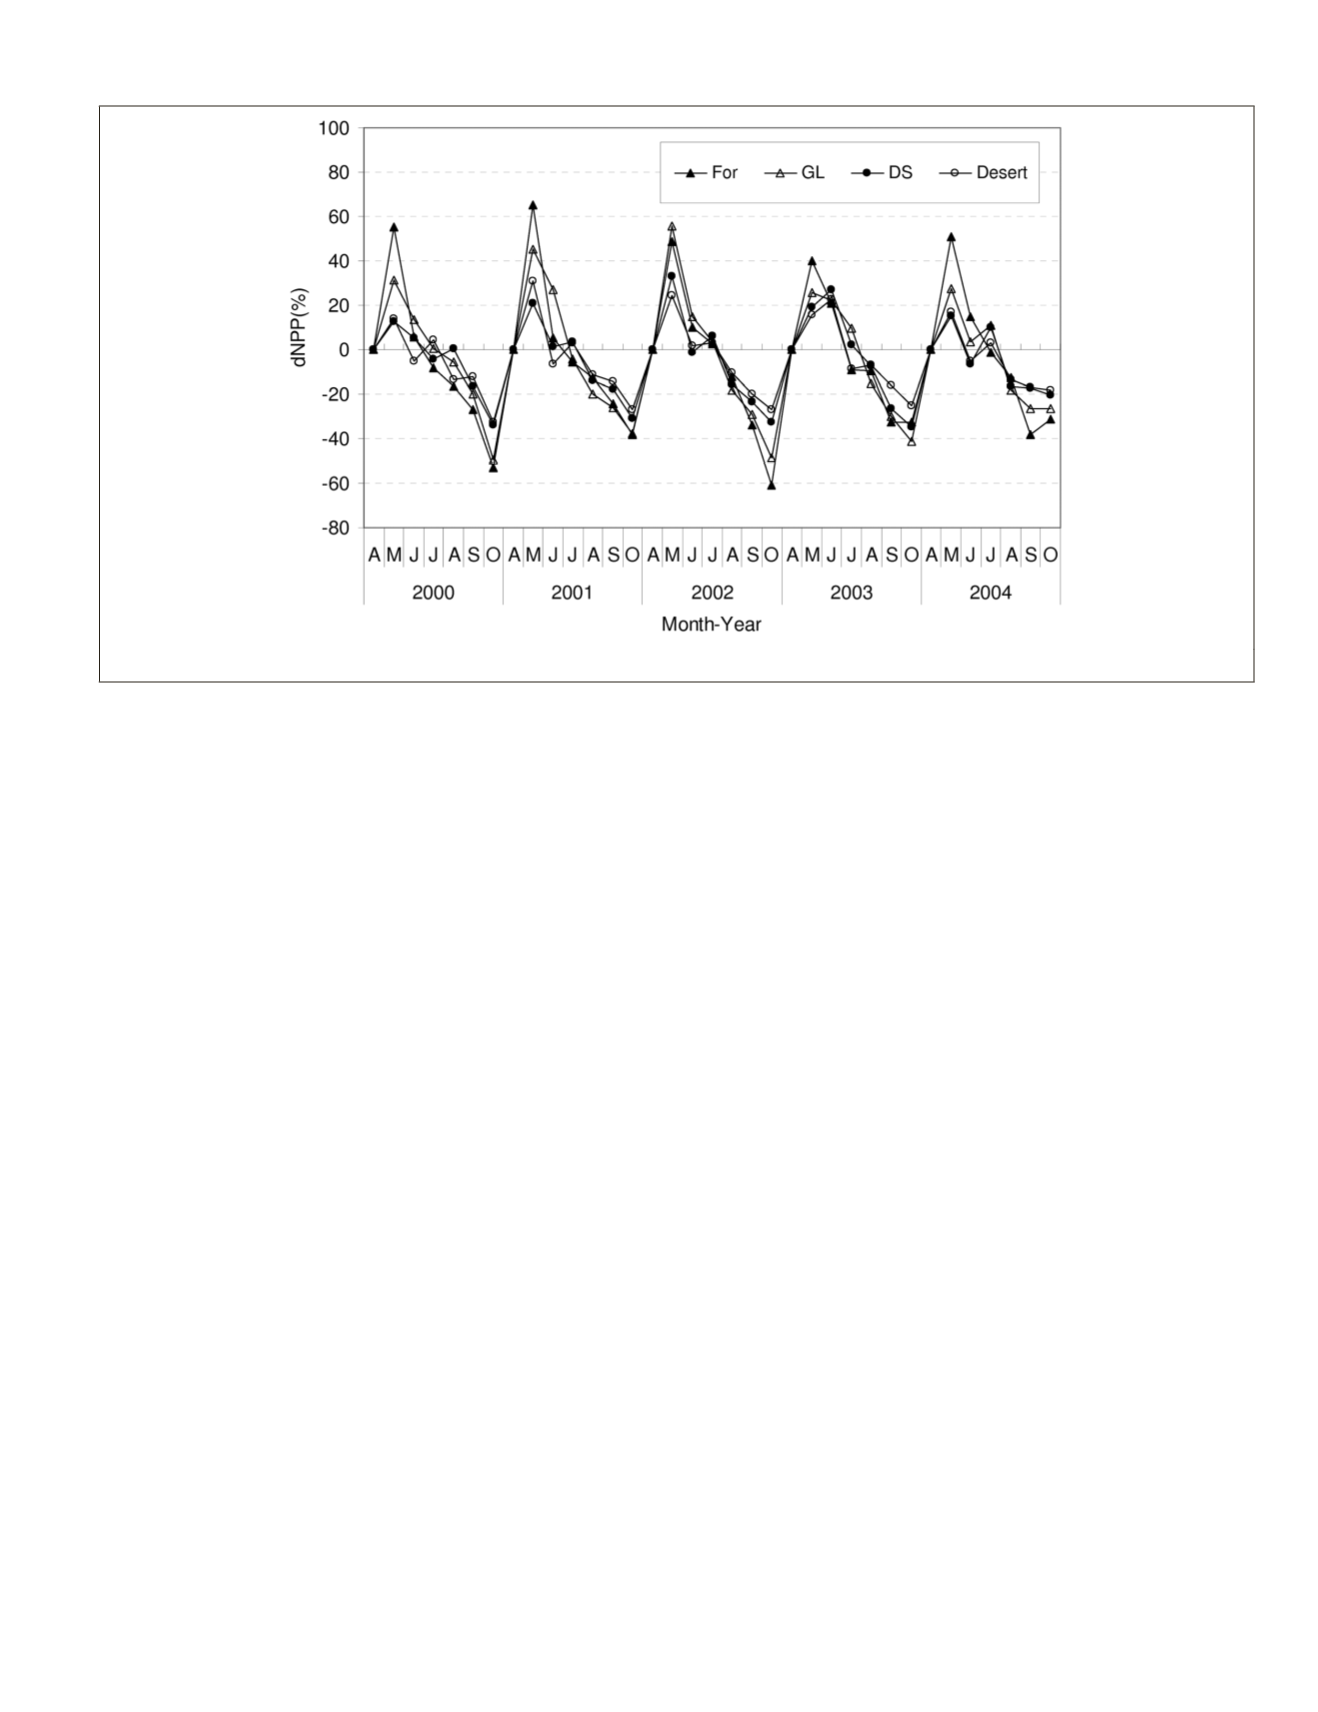
Figure 6. Temporal changes of
npp
growth rate of the vegetation types in Mongolia.
PHOTOGRAMMETRIC ENGINEERING & REMOTE SENSING
July 2015
595


