time-yearly, tYr (F(4, 280) = 0.30, P >0.875). This indicates
that the
NPP
s of Mongolia terrestrial ecosystems during the
years 2000 to 2004 had no statistical difference, and the
NPP
varied significantly among the months in a year (tMo) and
vegetation types (
VT
).
The mean average of annual
NPP
s determined based on
all of the months and vegetation types (shortened Yr_
mNPP
)
for the years 2000 to 2004 were between 62.04 to 64.54 gC
m
–2
mo
–1
. The mean average of monthly
NPP
determined us-
ing all of the monthly
NPP
s in months in years 2000 to 2004
(shortened Mo_
mNPP
) for the forest, grassland, desert steppe,
and desert was 110.86, 67.22, 46.21, and 27.25 gC m
–2
mo
–1
,
respectively. Based on the Duncan’s test, those values were
divided into four groups indicating that the Mo_
mNPP
of the
vegetation types significantly differed from each other where
forest > grassland > desert steppe > desert (Table 1). In ad-
dition, the mean average of monthly
NPP
s calculated using
the monthly
NPP
of all of the vegetation types (abbreviated
as VT_
mNPP
) were also statistically significant. The monthly
VT_
mNPP
were also divided into four groups (Table 2). Briefly
the VT_
mNPP
in June and July made the biggest biomass pro-
duction contribution to the Mongolian terrestrial ecosystem at
around 80.10 gC m
–2
mo
–1
, next 71.14 gC m
–2
mo
–1
in May and
August, then 53.00 gC m
–2
mo
–1
in April and September, and
finally 31.72 gC m
–2
mo
–1
in October.
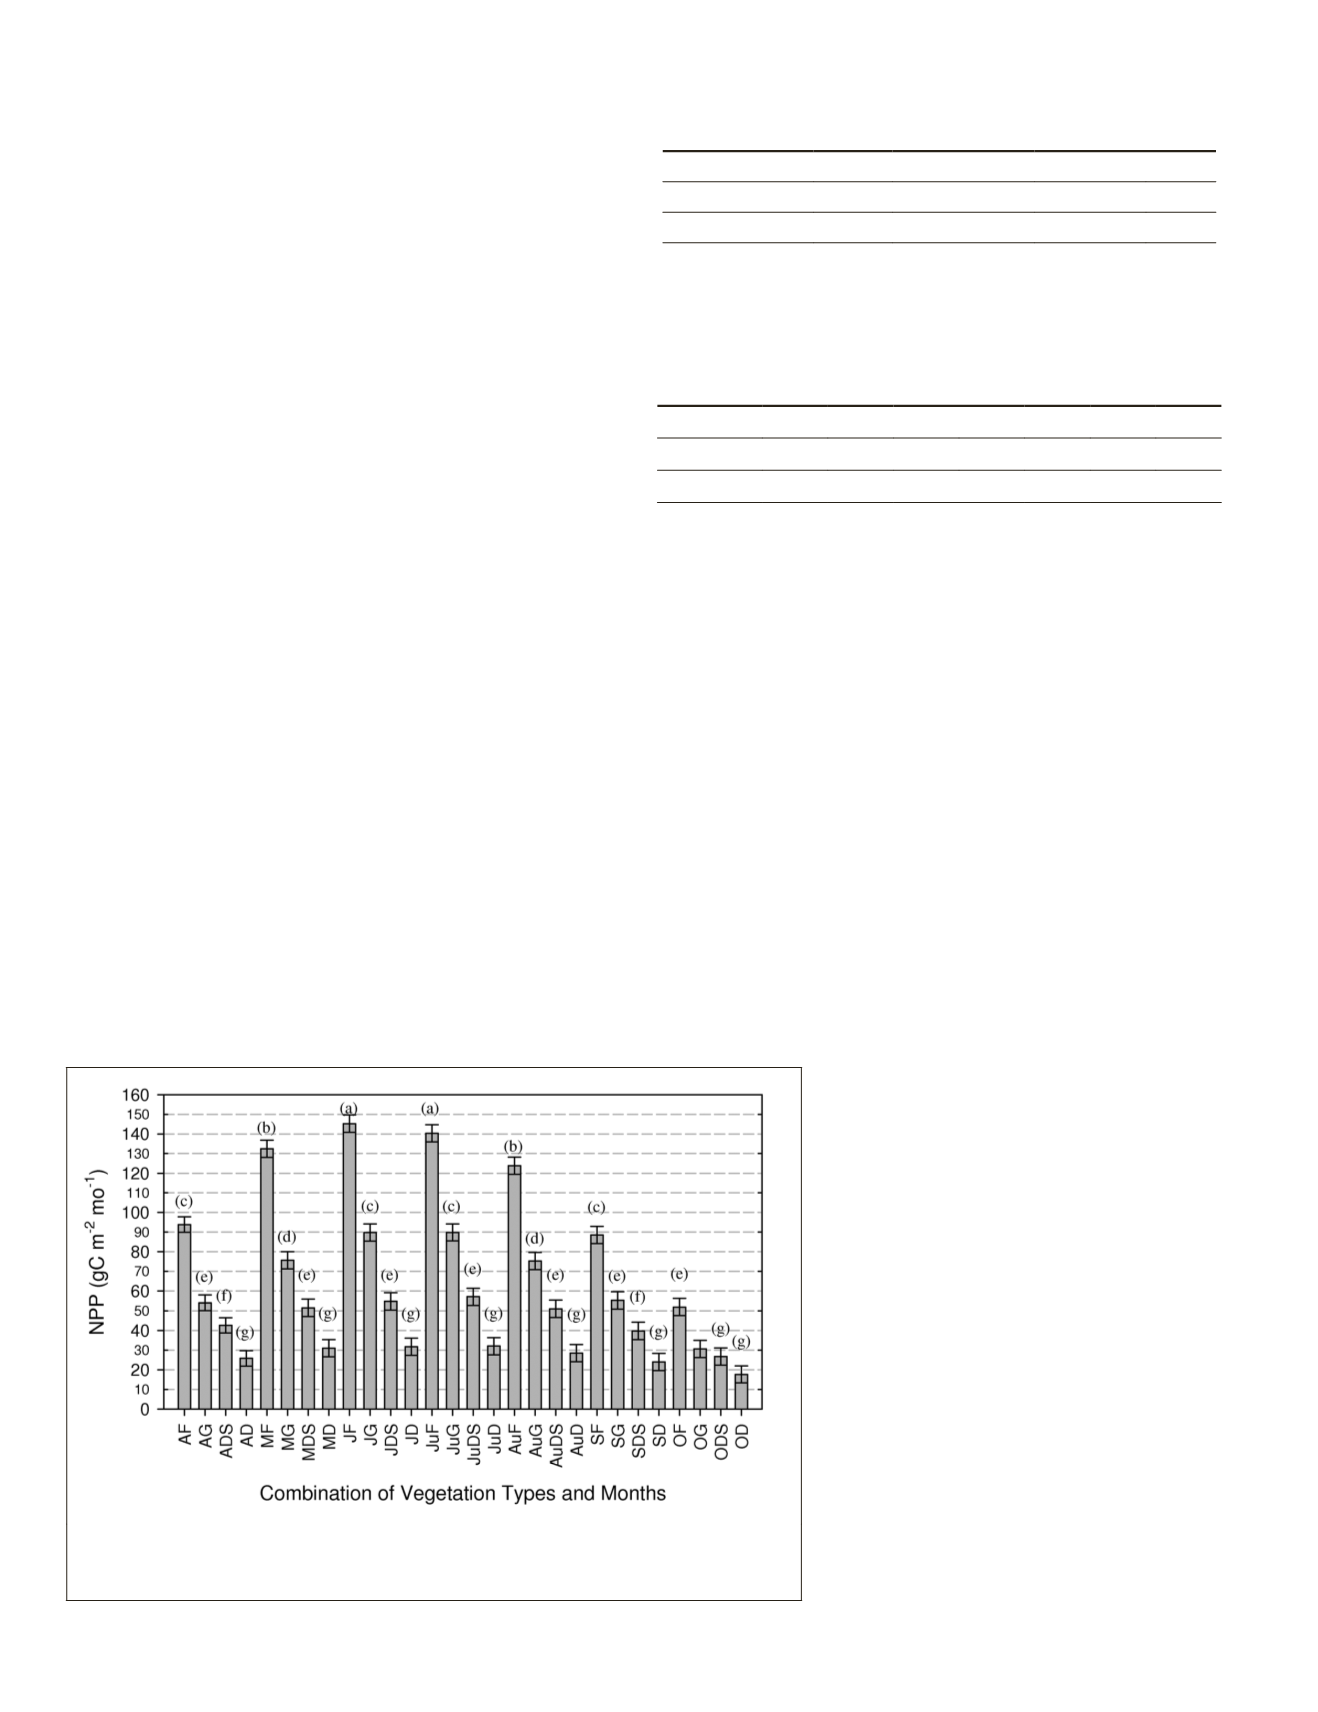
Figure 3 demonstrates the variation of
NPP
values in the
terms of interaction of
VT
and
tMo
.
NPP
of the 28 combination
of VT and tMo was classified into seven groups. Briefly, the
June-Forest (
JF
) and July-Forest (
JuF
) have the highest
NPP
at
around 145 gC m
–2
mo
–1
. The May-Forest (
MF
) and August-
Forest (
AuF
) have the second highest
NPP
at around 130 gC m
–2
mo
–1
, and this is followed by the April-Forest (
AF
), September-
Forest (SF), June-Grassland (
JG
) and July-Grassland (
JuG
) with
NPP
around 90 gC m
–2
mo
–1
. This indicates that the highest
NPP
value of Grassland in growing season is statistically identical
to that of Forest during the months at the fringe of the grow-
ing season. The grassland
NPP
in April and September (
AG
and
SG
) was also the same as that of October-Forest (
OF
) and the
NPP
of Desert Steppe in the period May-August (
MDS
,
JDS
,
JuDS
,
and
AuDS
) at around 50 gC m
–2
mo
–1
.
Relationship for the Monthly Average Values of NPP and Climate Factors
In Figure 4a, the monthly average temperature (
mTemp
) of each
of the four ecosystems varied in a similar trend throughout
the months and the years; while in Figure 4b, the monthly av-
erage precipitation (
mPrep
) in the areas of the four ecosystems
changed temporally inconsistently. The
mPrec
in each of the
terrestrial ecosystems showed a pattern similar to the pattern
of
mTemp
. In July 2000, only the mPrec in desert area dropped
off noticeably; this inconsistency reoccurred in the grassland
ecosystem in July 2001; later, the
mPrec
in the grassland area
increased abnormally in October 2002. The mPrec in the areas
of each of the terrestrial ecosystems coincidentally dropped
off following the same pattern in 2003, while an abnormally
lower precipitation occurred in June of that year.
Climatic factors such as temperature and precipitation drive
the vegetation productivity. The significance of the two vari-
ables on the prediction of vegetation
NPP
was further examined
using regression analysis with
ANOVA
F-test. The relationship
between the mean average of monthly
NPP
(shortened
mNPP
)
and the mTemp or the mPrec in each of the terrestrial ecosys-
tems can be generalized using nonlinear model. In Figure 5,
the level of
NPP
varied directly with a power function of the
mTemp while increasing as a logarithm function of the mPrec
for forest, grassland, desert steppe, and desert. Table 3 lists the
fitted
NPP
models using the
mTemp
or the mPrec. Those models
show a dramatic difference in the proportional change of
mNPP
among the terrestrial ecosystems. Briefly,
the slope coefficient of the power models
for grassland, forest, desert steppe, and des-
ert was 0.6495, 0.5964, 0.2154, and 0.1687,
respectively; this implies that the effect
of temperature on grassland
mNPP
was the
largest followed by a lesser effect on forest,
desert steppe, and finally desert. The slope
coefficient of the logarithm models for for-
est, grassland, desert steppe, and desert was
27.9592, 16.1714, 6.7736, and 2.3884, re-
spectively. This indicates that the precipita-
tion had a greater effect on the
mNPP
of forest
and grassland and a smaller effect on desert
steppe and desert. It may also be concluded
that a significant anomaly precipitation will
cause serious impact on terrestrial
NPP
(Pei
et al.
, 2013). In the view of the coefficient of
determination (R
2
) among the temperature-
based
mNPP
models, the
mNPP
variations in
each of the Mongolian terrestrial ecosys-
tems can be explained by the mean average
of monthly temperature being 81, 85, 71,
and 64 percent for forest, grassland, desert
steppe, and desert respectively. In contrast,
the
mNPP
variations in forest, grassland,
T
able
1. R
esult
of
the
D
uncan
’
s
T
est
for
the
D
ifference
between
the
M
o
_
m
NPP
of
V
egetation
T
ypes
Vegetation type Desert
Desert steppe Grassland Forest
NPP
27.25
46.21
67.22 110.86
Grouping*
a
b
c
d
*: Alphabetical codes in the entries of “Grouping” stand for the
grouping of the mean value of NPP as determined by Duncan’s test.
NPP values with the same letter indicating that there is no difference
between them at the 0.05 probability level.
T
able
2. R
esult
of
the
D
uncan
’
s
T
est
for
the
D
ifference
between
the
VT_
m
NPP
in
M
onths
Month
Oct Sept Apr Aug May Jul
Jun
NPP
31.72 51.90 54.09 69.63 72.65 79.81 80.39
Grouping* a
b b
c
c
d d
*: same as table 1.
Figure 3. Bar chart of the NPP values for the interactions of vegetation types (
vt
) and
months (
t
m
o
). The error bar shows the standard error of
npp
and the alphabets above
the bars represent the group codes.
592
July 2015
PHOTOGRAMMETRIC ENGINEERING & REMOTE SENSING


