This also indicates the temporally precipitation shortage in
early of the growing season would not probably cause serious
water-stress to forest and grassland. It is inferred that forest
and grassland ecosystems seem less sensitive to a short-span
shortage of precipitation during the growing season.
In contrast to the relationship demonstrated in previous
section, forests tend to exist in an environment where soil
moisture is sufficient such that increasing
NPP
is likely to be
associated with higher temperature. In addition, Bat-Oyun
et
al
. (2010) revealed by analyzing the effects of temperature and
water stress on vegetation productivity that water stress is a
stronger down-regulator of
NPP
in the Mongolian grasslands.
The slight changes in rainfall during the critical months of
May through July in this region resulted in a large difference in
the aboveground
NPP
of the Mongolian plateau (Chuluun and
Ojima, 2002). Moreover, the variation of annual
NPP
at given
location are not only due to variations of precipitation amount
but also probably due to changes in the growing season length
(Piao
et al
., 2003) and nutrient availability (Owensby
et al
.,
1970). Grazing intensity is another driver of the decrease of
NPP
increment due to increasing numbers of livestock in Mon-
golia (Chen
et al
., 2007; Sugita
et al.
, 2007; Li
et al.
, 2005).
Changes of the Spatial Pattern of NPP Growth
Results of the factorial
ANOVA
reveal that Mongolian terres-
trial ecosystems’
NPP
s exhibited significant difference among
the interaction of vegetation types (
VT
) and during different
months (tMo). Since the 95 percent confidence interval of
the
NPP
values for the combination of
VT
and
tMo
was 17.24
(gC m
–2
mo
–1
), the Duncan’s multiple range test determined
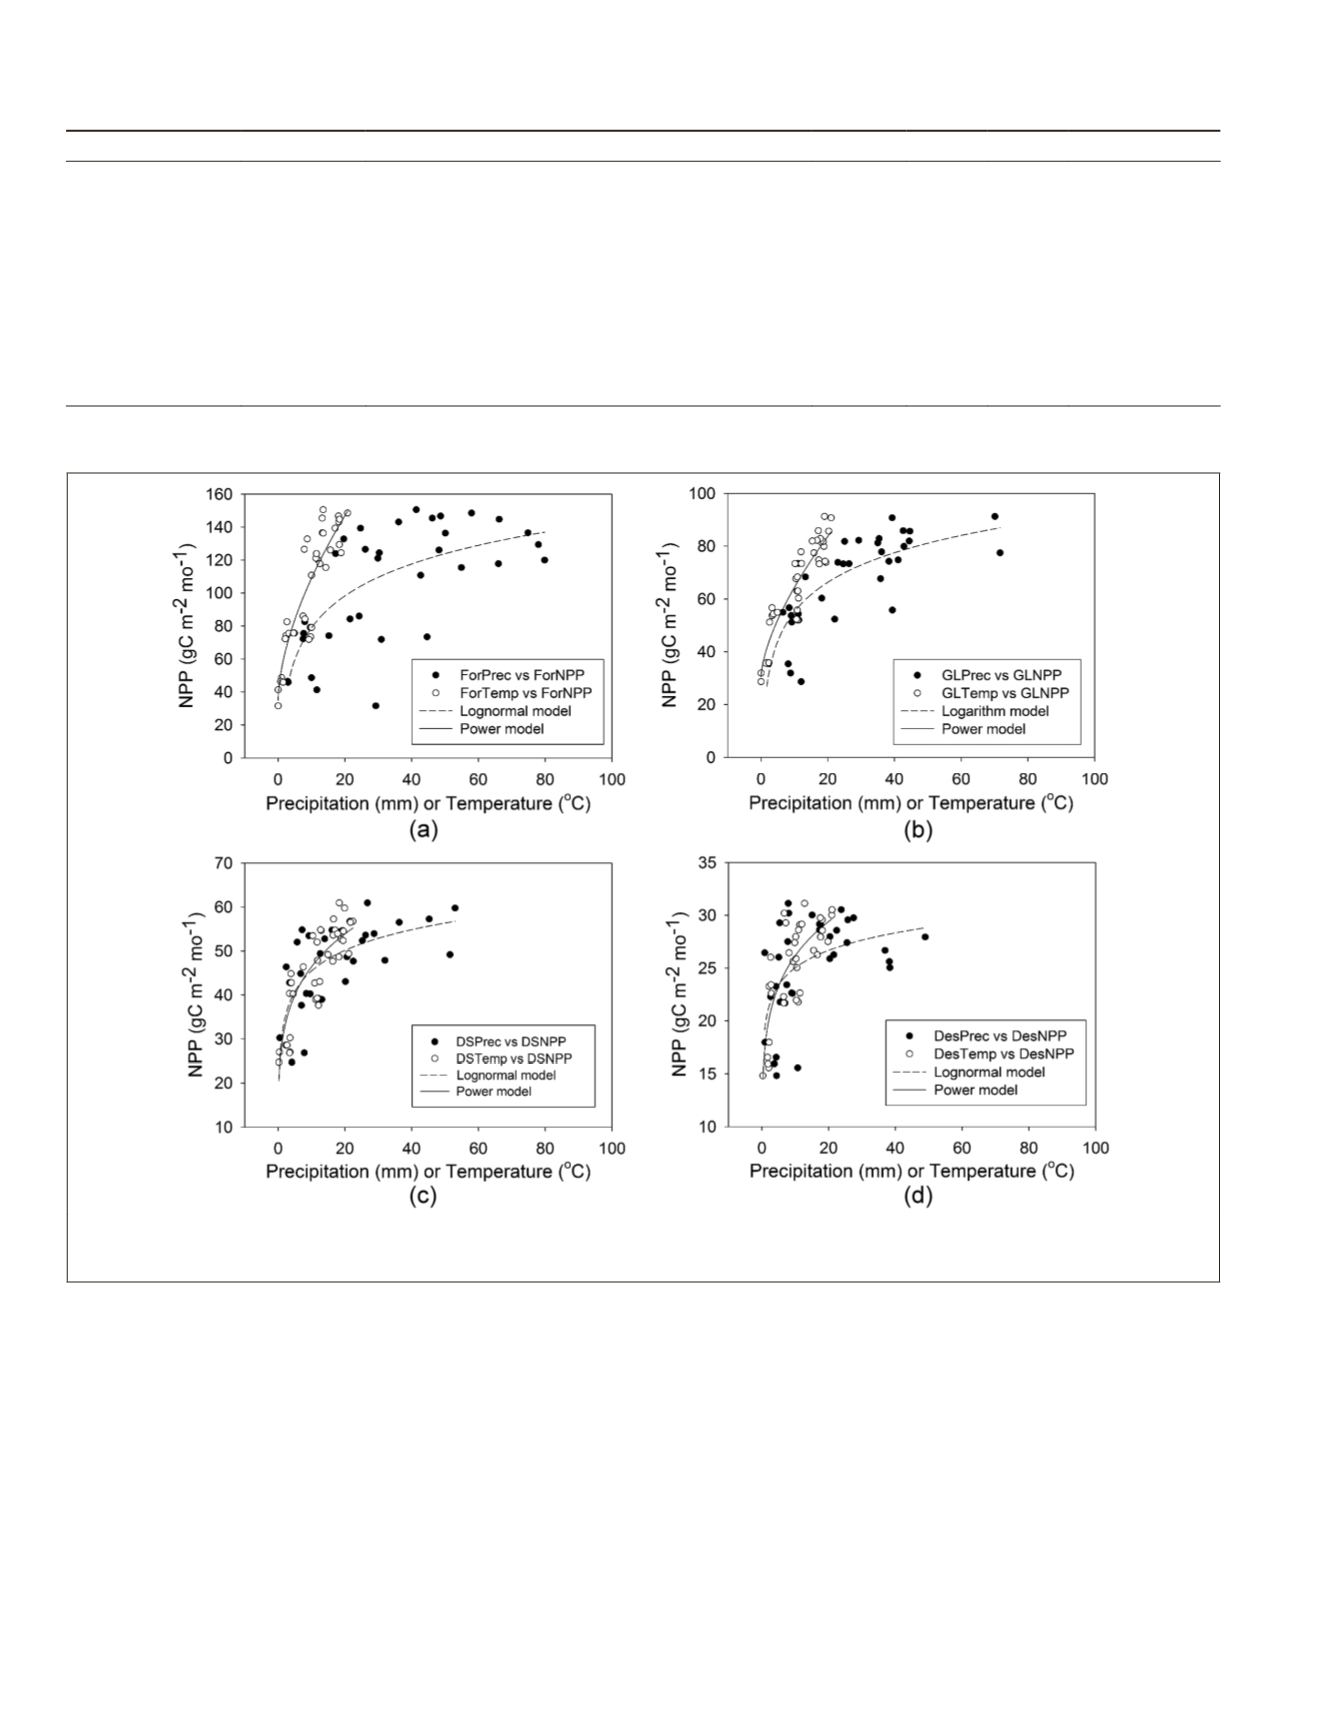
T
able
3. T
he
D
erived m
npp
M
odels
of
the
T
errestrial
E
cosystems
in
M
ongolia
Vegetation types
Regressor (
x
)
Equations
#
(y is mNPP, gC m
–2
mo
–1
)
F
#
R
2
R
Model types
Forest
mTemp
y
= 34.9889 + 18.7513
x
0.5964
69.9** 0.81 0.90
Power
mPrec
y
= 14.5106 + 27.9592ln(
x
)
33.5** 0.50 0.71
Logarithm
Grassland
mTemp
y
= 30.5133 + 7.6005
x
0.6495
93.5** 0.85 0.92
Power
mPrec
y
= 17.8821 + 16.1714ln(
x
)
61.0** 0.65 0.81
Logarithm
Desert steppe
mTemp
y
= 28.2790
x
0.2154
81.5** 0.71 0.84
Power
mPrec
y
= 29.8713 + 6.7736ln(
x
)
30.4** 0.48 0.69
Logarithm
Desert
mTemp
y
= 17.7519
x
0.1687
57.9** 0.64 0.80
Power
mPrec
y
= 19.5453 + 2.3848ln(
x
)
11.3** 0.26 0.51
Logarithm
#: The symbol “**” indicates the F-value is significant at the probability 0.01. ##: mNPP is the abbreviation of the mean average of monthly
NPP for different vegetation types.
Figure 5. An illustration of the relationship between the mean of monthly
npp
and the monthly average temperature or precipitation for
the vegetation types: (a) forest, (b) grassland, (c) desert steppe, and (d) desert in Mongolia. The dots and circles in every subfigure repre-
sent precipitation and temperature respectively.
594
July 2015
PHOTOGRAMMETRIC ENGINEERING & REMOTE SENSING


