Results
The monthly
NPP
in Mongolia have shown a temporal varia-
tion that is almost identical in each of the years 2000 to 2004.
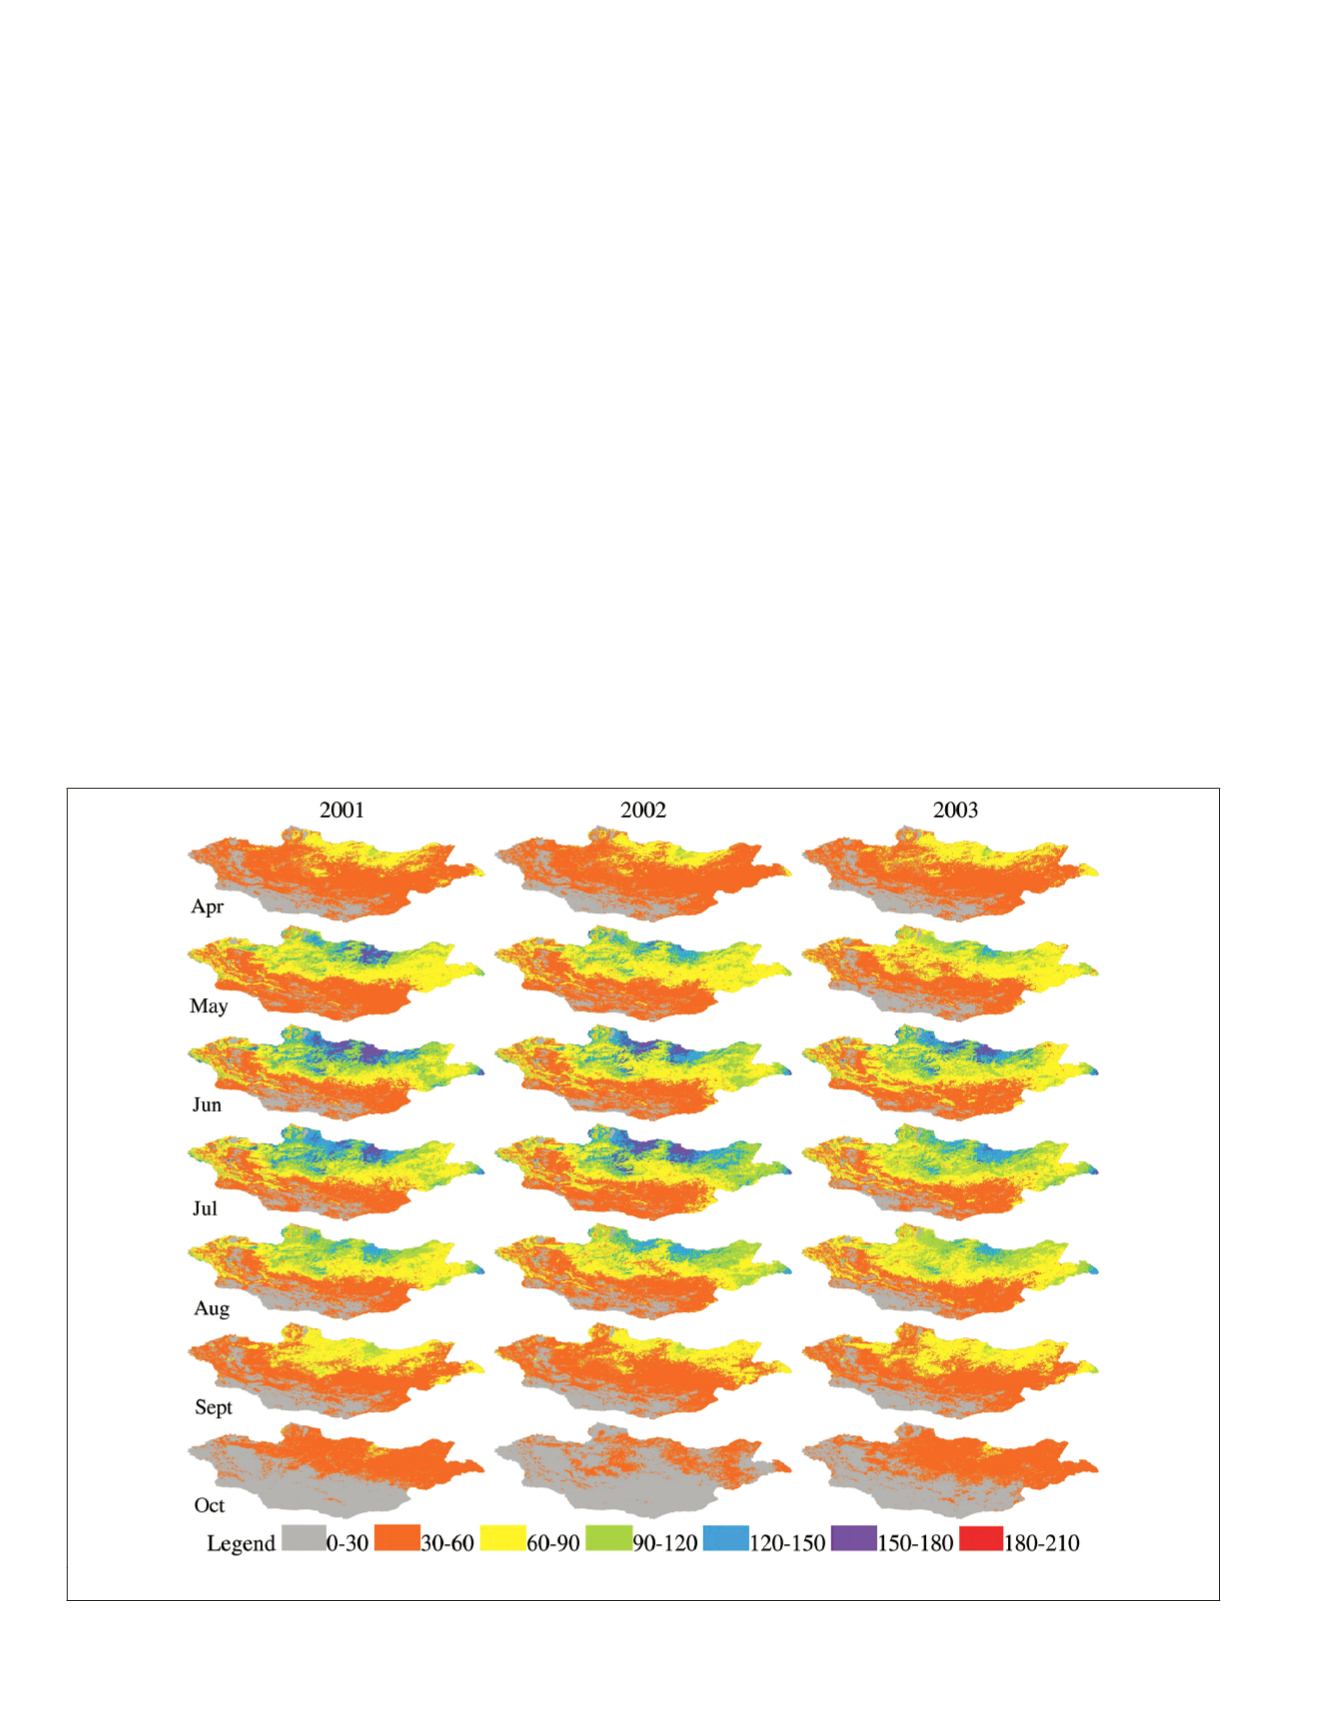
Detail of the
NPP
distribution in 2001 to 2003 was shown in
Plate 1, the other years were not shown here due to their simi-
larity. A lower level
NPP
started in April and then continuous-
ly increased until reaching a peak in July before decreasing
to a similar lower level in September. The lowest level of
NPP
among the seven months was in October. The calculated
NPP
ranged from 0 to 210 gC m
–2
mo
–1
during the observed peri-
ods.
NPP
in the terrestrial ecosystems of Mongolia in each of
the months was generally observed to have a higher value in
the North declining to a lower value in the South. This kind
of variation in the spatial pattern of
NPP
still could be seen
even in April, September, and October whose
NPP
was much
lower than the months from May to August. Plate 2 gives two
examples of the spatial profile of
NPP
from north to south dur-
ing 2004. The plateau (with bigger
NPP
s) distributed across the
North and the lowland (with smaller
NPP
s) in the South indi-
cates that northern Mongolia experienced superior productiv-
ity to the South. This pattern was similar to the geographical
distribution of terrestrial ecosystems in the country.
The mean average of monthly
NPP
(
mNPP
) of each of the
vegetation types started to increase in April with a peak in
June/July and then decreased until October. These results
coincide with the seasonality of temperature and precipitation
(Dugarsuren and Lin, 2011). The
mNPP
of these vegetation types
all varied like a parabolic curve over a one-year period but
the curve for each type had varying amplitudes. As shown in
Figure 2, the biggest amplitude was around 100 gC m
–2
mo
–1
for
the forest, the second one was around 50 gC m
–2
mo
–1
for the
grassland (shortened as
GL
), the third was close to 20 gC m
–2
mo
–1
for the desert steppe (shortened as
DS
), and the smallest
amplitude was around 10 gC m
–2
mo
–1
for the desert. The
mNPPs
of the lake ecosystem (the water in Figure 2) were almost equal
to zero throughout the growing seasons of the each of the years.
The estimated minimum and maximum values of monthly
NPP
in the 35 months span were 12.52 and 174.97, 18.09 and
127.94, 17.33 and 84.50, 13.17 and 43.14, and 0.00 and 0.02
gC m
–2
mo
–1
for forest, steppe, desert steppe, desert, and water,
respectively. As a result, the determined monthly
NPP
of the
whole area in Mongolia from April to October in 2000 to 2004
was between 0.0446 and 0.1352 PgC mo
–1
.
The fluctuation of
NPP
accumulated monthly during the
years 2000 to 2004 in Mongolia is similar to the variation of
monthly average
NPP
of vegetation types (Figure 2). Since the
temperature in Mongolia generally starts to drop below 0°C in
late October, and the land remains below freezing until early
April; the total amount of annual
NPP
can be calculated using
the summation of the monthly
NPP
from April to October in a
given year. As a result, the annual
NPP
of the whole Mongolia is
0.7285, 0.7227, 0.7070, 0.7012, and 0.7225 PgC yr
–1
for the years
from 2000 to 2004, respectively. The five-year mean average
and standard deviation of annual
NPP
is 0.7149
±
0.0116 PgC yr
–1
.
Discussion
Using a Clean Lake as an Indicator of Prediction Bias for Tuning NPP Estimate
Based on the examination of water quality using the data
collected by water quality monitoring networks in
UNP/WHO
Plate 1. The predicted monthly
npp
(gC m
–2
mo
–1
) of the whole area in Mongolia in 2001 to 2003.
590
July 2015
PHOTOGRAMMETRIC ENGINEERING & REMOTE SENSING


