GEMS
programme (
UNEP
, 1995), Kelderman and Batima (2006)
concluded that the water quality of the rivers originating
from northern Mongolia and flowing into Lake Khovsgol (also
called Khuvsugul) is clean in terms of total suspended solid,
total dissolved solid, electrical conductivity, and water pol-
lution parameters. Nutrient contents such as NH
4
-N, NO
3
-N,
PO
4
-P, and permanganate value in the rivers was 0.23, 0.13,
<0.01, and 4.0 (mg/L) less than the maximum allowable
concentrations determined by Mongolian environmental
standards. In addition, Davaa
et al
. (2006) also demonstrated
Lake Khovsgol has very low value of water quality index
(W
qi
<0.3) which accounts for the pollutants concentration
of dissolved oxygen, biochemical oxygen demand, chemical
oxygen demand, ammonium, nitrate, and nitrite. These stud-
ies agreed that lake water of Khovsgol is very clean. Since the
nutrient contents during the period 1940 to 2002 are so small
that phytoplankton is extremely limited, there should be
little chlorophyll present for lake to exhibit
NPP
. On the other
words, Lake Khovsgol should have no positive
NPP
and thus
any anomaly
NPP
whose values are greater than zero could be
an indicator of prediction bias.
By zonal maximum analysis, an anomaly value of the
CASA
model derived
NPP
0.02 gC m
–2
mo
–1
was found in the subarea
of Lake Khovsgol in 2000 to 2004 multi-temporal images.
Although this quantity is small, it should be logically consid-
ered as a prediction bias that was probably caused by envi-
ronmental factors and the uncertainty of model parameters
measurement. It is suggested that this quantity be adopted as
an adjustment scalar (S
adj
) for tuning the terrestrial ecosys-
tems’
NPP
. In summary, the
CASA
model derived first estimates
of terrestrial ecosystems’
NPP
(
NPP
original
) is tuned using the
criterion
NPP
=
NPP
original
– S
adj
.
ANOVA-Derived Differences of Monthly-Yearly NPP among Vegetation Types
The
ANOVA
revealed significant main effect for the vegetation
types,
VT
(F(3, 280) = 470.79, P <0.001) and the time-monthly,
tMo (F(6, 280) = 66.17, P <0.001) but insignificant for the
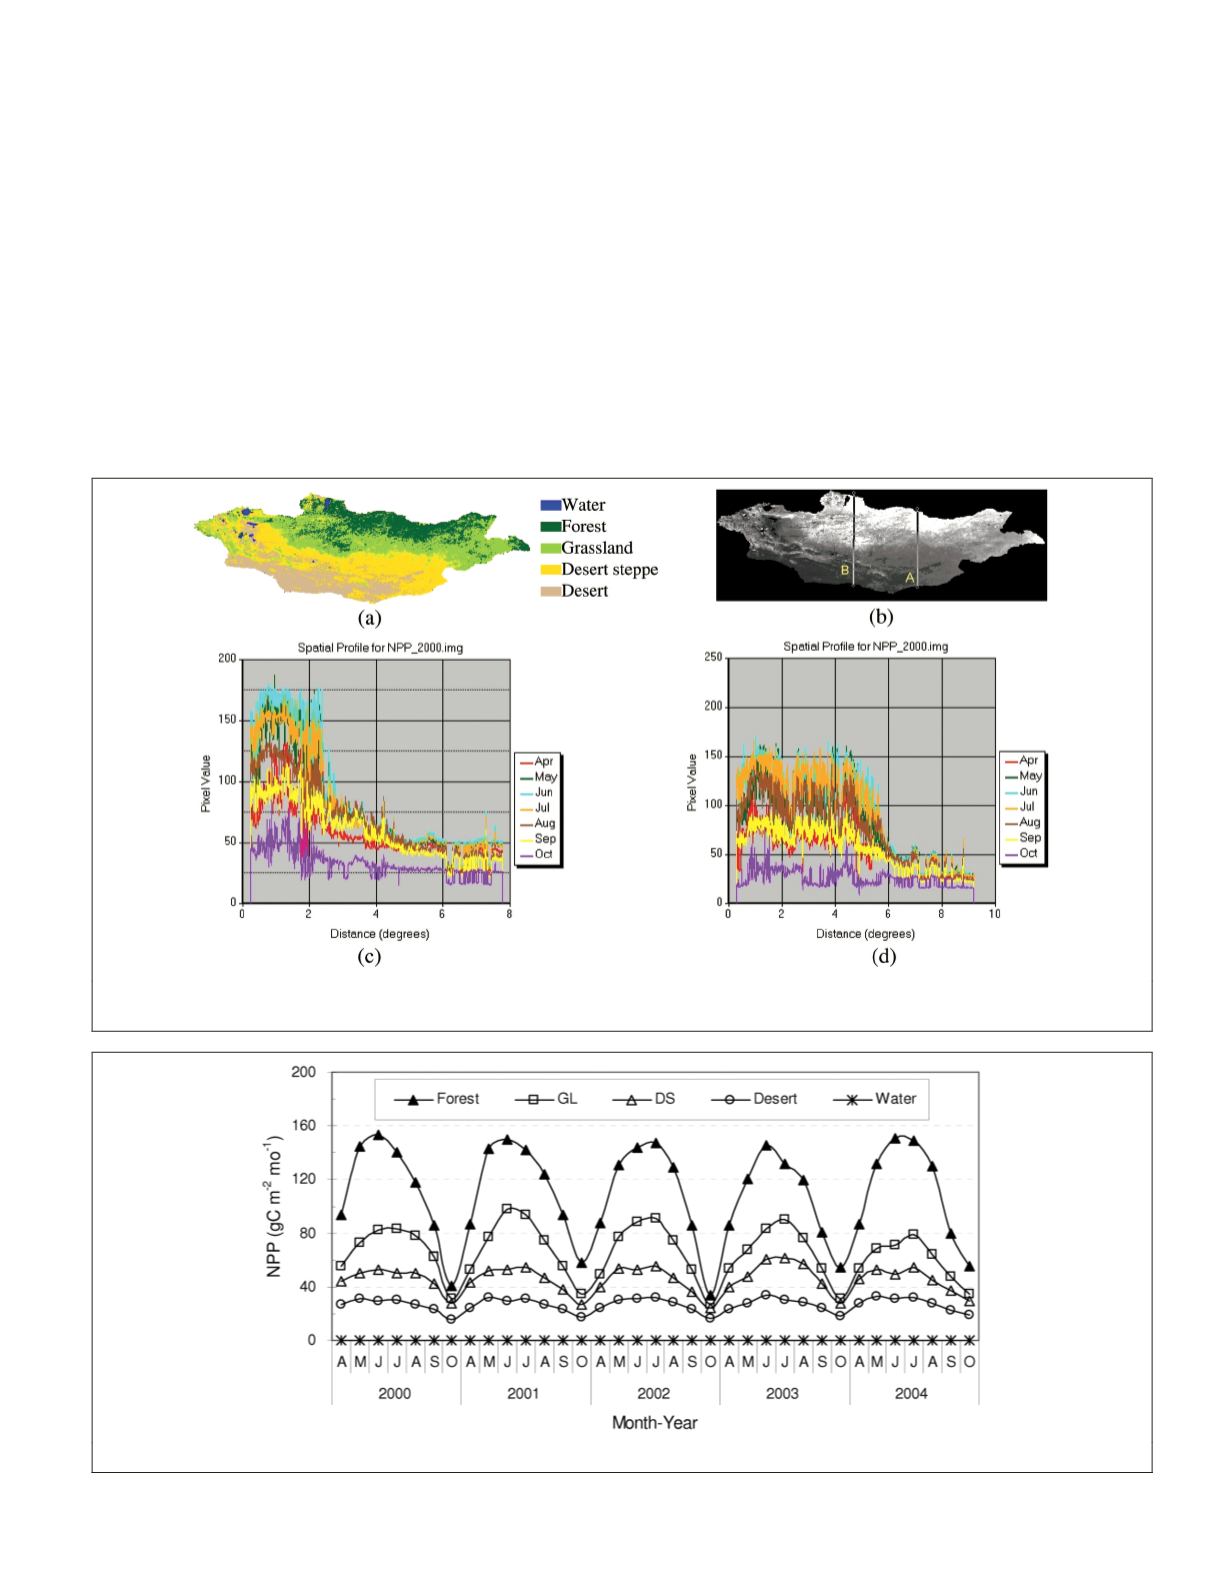
Plate 2. (a) Land cover map of Mongolia and examples of the spatial distribution of
npp
in 2004. Transect lines A and B in subfigure (b)
start in the North and end in the South whose pixel values (gC m
–2
mo
–1
) across the profiles as illustrated in subfigures (c) and (d).
Figure 2. A temporal variation of the mean average of monthly
npp
(
m
npp
for different vegetation types in 2000 to 2004.
PHOTOGRAMMETRIC ENGINEERING & REMOTE SENSING
July 2015
591


