Classification Process
Seasonal matrices of
Ts
−
Ta
and
NDVI
binary classes were
used to define seasonal profiles, that provided an indication
for each season as to whether or not irrigation was currently
applied and the crop was actively growing. As shown in
Figure 5, the three seasonal profiles were combined together
to identify possible land covers. A set of decision rules were
developed as listed in Table 2. A contiguity analysis was car-
ried out to identify and filter out the small isolated groups of
pixels (<6 pixels, equivalent to < ½ ha) which were consid-
ered unlikely to belong to any managed irrigation system.
T
able
2. L
and
C
over
C
riteria
Land cover description
Class ID based on
Ts−Ta
and
NDVI segments
Spring
Summer Autumn
Spring active
S4, S3* S1, S2 S1, S2
Summer active
S1, S2 S4, S3* S1, S2
Autumn active
S1, S2 S1, S2 S4, S3*
Perennially active
S4
S4
S4
Perennially active (Secondary)# S4, S3 S4, S3 S4, S3
Seasonally active
Spring-summer
S4, S3* S4, S3* S1, S2
Spring & autumn
S4, S3* S1, S2 S4, S3*
Summer-autumn
S1, S2 S4, S3* S4, S3*
Note: Refer to Figure 3 for the description of class ID.
* Spatial context to consider S3 with S4
# S4 in any two seasons
Results
NDVI and
Ts − Ta
NDVI
and
Ts
−
Ta
were jointly used to detect irrigated area
within each season at pixel level. Figure 6 shows an example
of January 2013 where data points have been identified
whether irrigated or not on the basis of thresholds.
Both
NDVI
and
Ts
−
Ta
varied considerably across
CGID
and
over the three seasons. The average
NDVI
within
CGID
in spring
was 0.6, reducing to 0.32 in summer, and increasing slightly
to 0.4 in autumn. However, the maximum
NDVI
values, which
are usually representative of well watered areas, were fairly
similar through the seasons, with 0.89 in spring, 0.86 in sum-
mer, and 0.88 in autumn. Relative temperature differences,
represented by
Ts
−
Ta
measure, also varied spatially and
across seasons.
Ts
−
Ta
ranged between -13.5°C and 16.6°C
with an average of 6.3°C in spring. In summer, the range
increased, being between -20.9°C and 28.6°C with an average
of 15.2°C. The autumn temperatures were milder, and
Ts
−
Ta
ranged between −13.1°C and 19.5°C, with an average of 3.1°C.
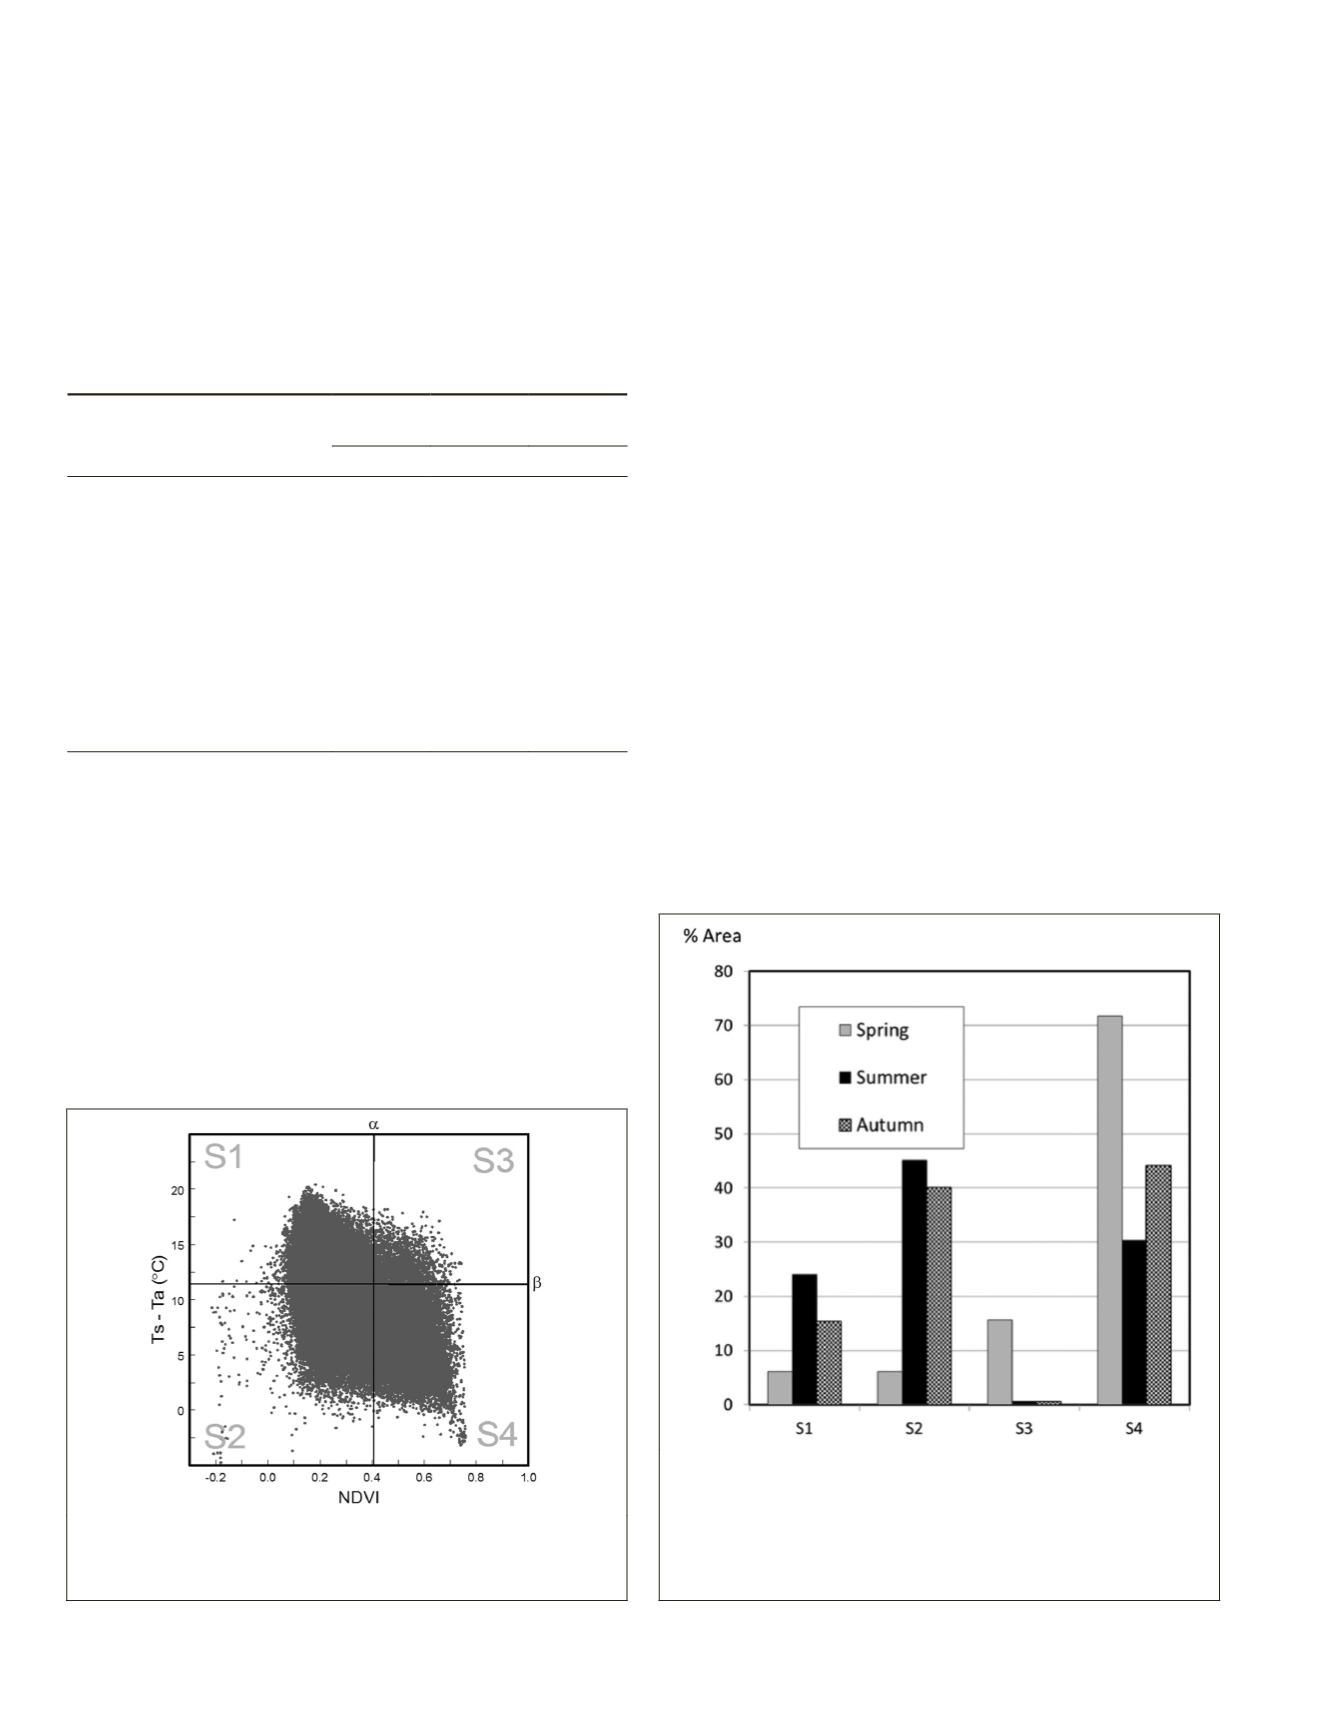
Seasonal Irrigation Activities
The pixel level results of seasonal irrigation activities are
shown in Figure 7. A large proportion (74 percent) of the
total
CGID
area was identified as irrigated crop/pasture (S4) in
spring. This proportion was just 30 percent in summer and
44 percent in autumn (Figure 7). The area identified as crops/
pasture with dry condition (S3) was the highest in spring, but
was minimal (1 percent) in summer and autumn. Wet condi-
tions, with no or negligible vegetation (S2), were common
in summer (45 percent) and autumn (40 percent). Dry condi-
tions, with no or negligible vegetation, mostly occurred in
summer (24 percent) and autumn (15 percent).
Irrigated Land Cover Classes
Figures 8, 9. and 10 show the examples of seasonal patterns of
NDVI
and temperature. These patterns helped understand the
crop and irrigation activities through different seasons. It was
therefore possible to identify the actively growing irrigated
areas in each season as shown in Plate 2.
The results of irrigated land cover classes, as identified
using seasonal profile based on
NDVI
and
Ts
−
Ta
, are shown
Plate 3. Most growers use irrigation to maintain their pas-
tures/crops throughout the irrigation season. However, the
2012/2013 year came towards the end of a long (decadal)
drought in Australia. Water allocations were still restricted,
and the growers were more cautious on watering regimes. As
Figure 7. Seasonal irrigation activities at pixel level for
cgid
during 2012/2013. The proportion is shown in relation to total
farmland which is 1,290 sq. km. S1 = Dry with no/low vegeta-
tion. S2 = Wet with low/no vegetation. S3 = Dry with some
vegetation, possibly crop. S4 = Wet with growing vegetation
(irrigated crop/pasture).
Figure 6. An example of
ndvi
and
Ts − Ta
to define pixels based
on thresholds (
α
and
β
). The data points refer to 01 January
20113 derived from
aster
.
234
March 2015
PHOTOGRAMMETRIC ENGINEERING & REMOTE SENSING


