between the elevation error and slope and aspect. The annual
composite forest cover data (DiMiceli
et al.
, 2001) of 2000,
obtained from the Global Land Use Database of the Univer-
sity of Maryland, display the distribution of vegetation types
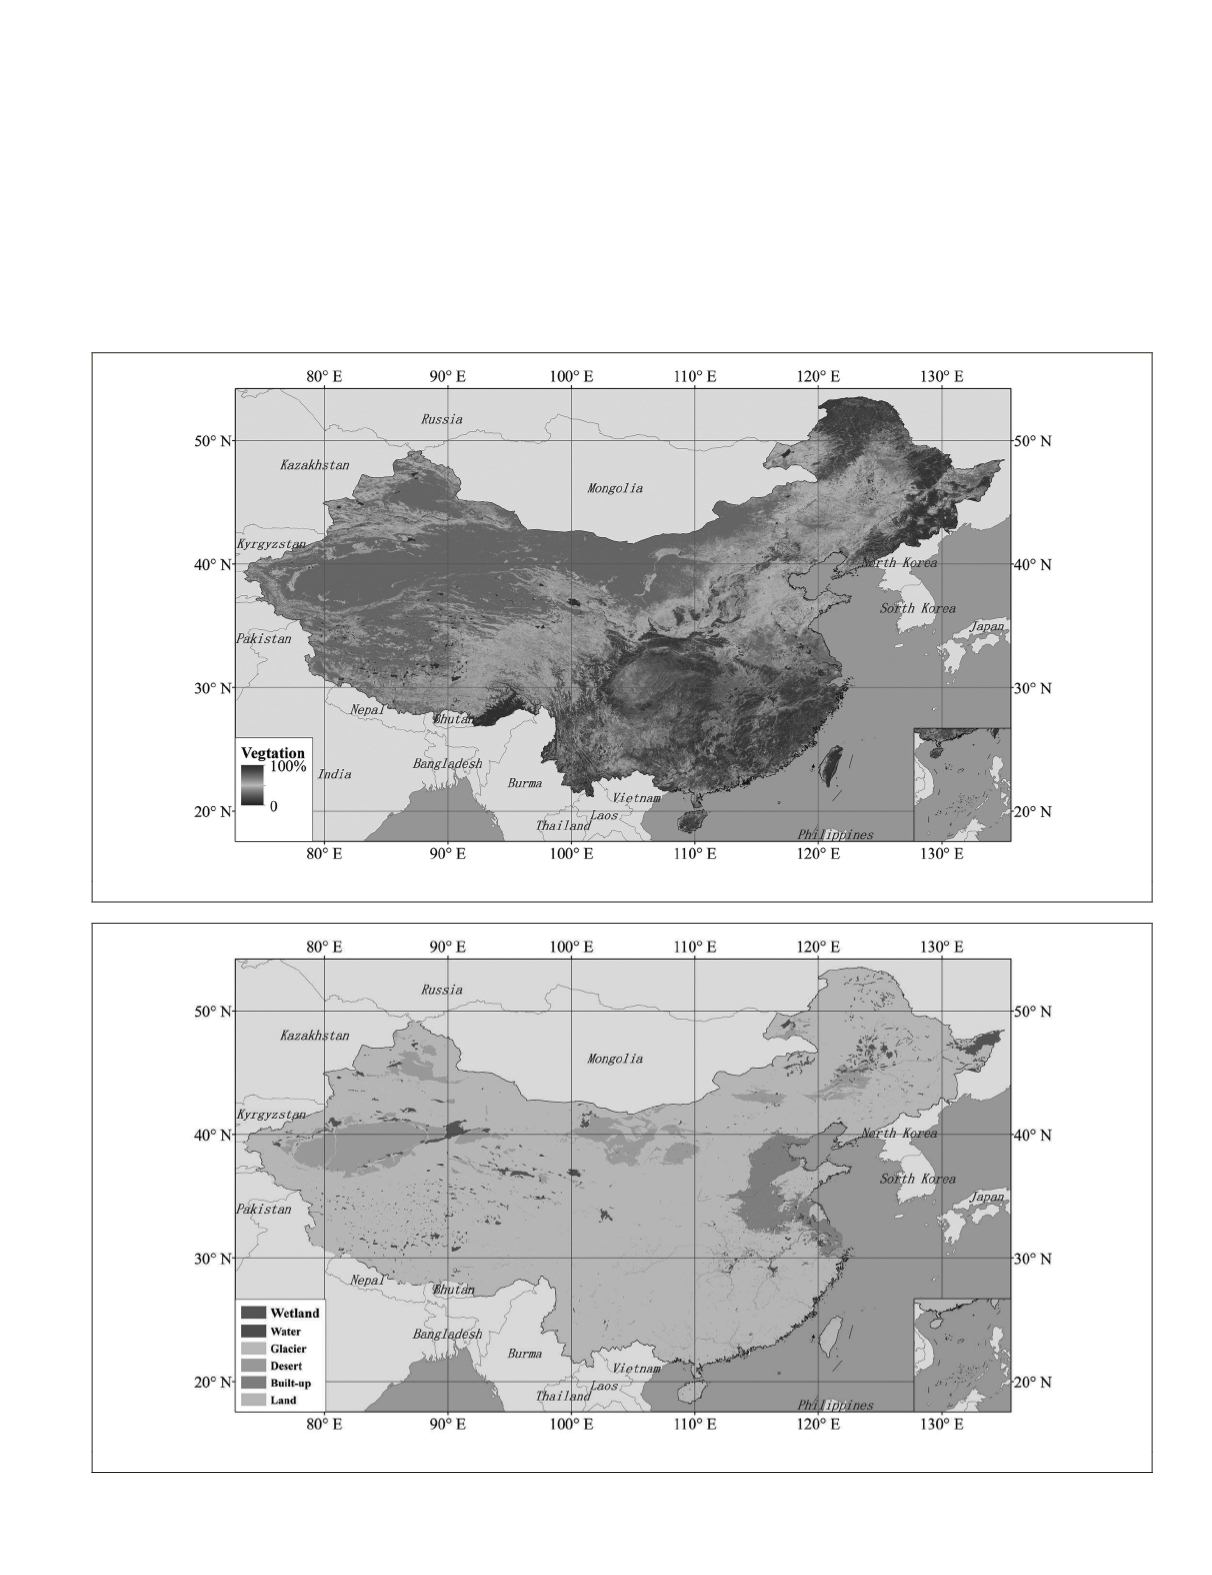
and coverage in China relatively accurately (Figure 1). These
data have been used in other analyses of
SRTM
errors (Han-
sen
et al.
, 2003; Carabajal and Harding, 2006; Van Niel
et al.
,
2008, Shortridge and Messina, 2011). The North China Plain
and the plains in the lower reaches of the Yangtze River are
topographically flat and include widely distributed densely
urbanized areas. The
SRTM
data of these regions contains
information that includes the height of the urban built-up
areas, so the areas with dense urbanization were located from
Google Earth
™
image maps. Furthermore, distribution maps
of glaciers (Wu and Li, 2014), deserts (Wang
et al.
, 2005b),
and wetlands (NIGA, 2000) were obtained from the Cold and
Arid Regions Science Data Center of the Chinese Academy of
Sciences. Glaciers, deserts, and wetlands, which are concen-
trated in western and northern China, are active subjects in
climate change research (Shi
et al.
, 2007). The radar signals
show different characteristics in these areas compared with
bare land and land covered by vegetation, so it is necessary to
study the characteristics of the elevation error in these land
types (Figure 2) separately.
Figure 1. Vegetation cover in China.
Figure 2. Different land-cover types in China.
PHOTOGRAMMETRIC ENGINEERING & REMOTE SENSING
February 2016
137


