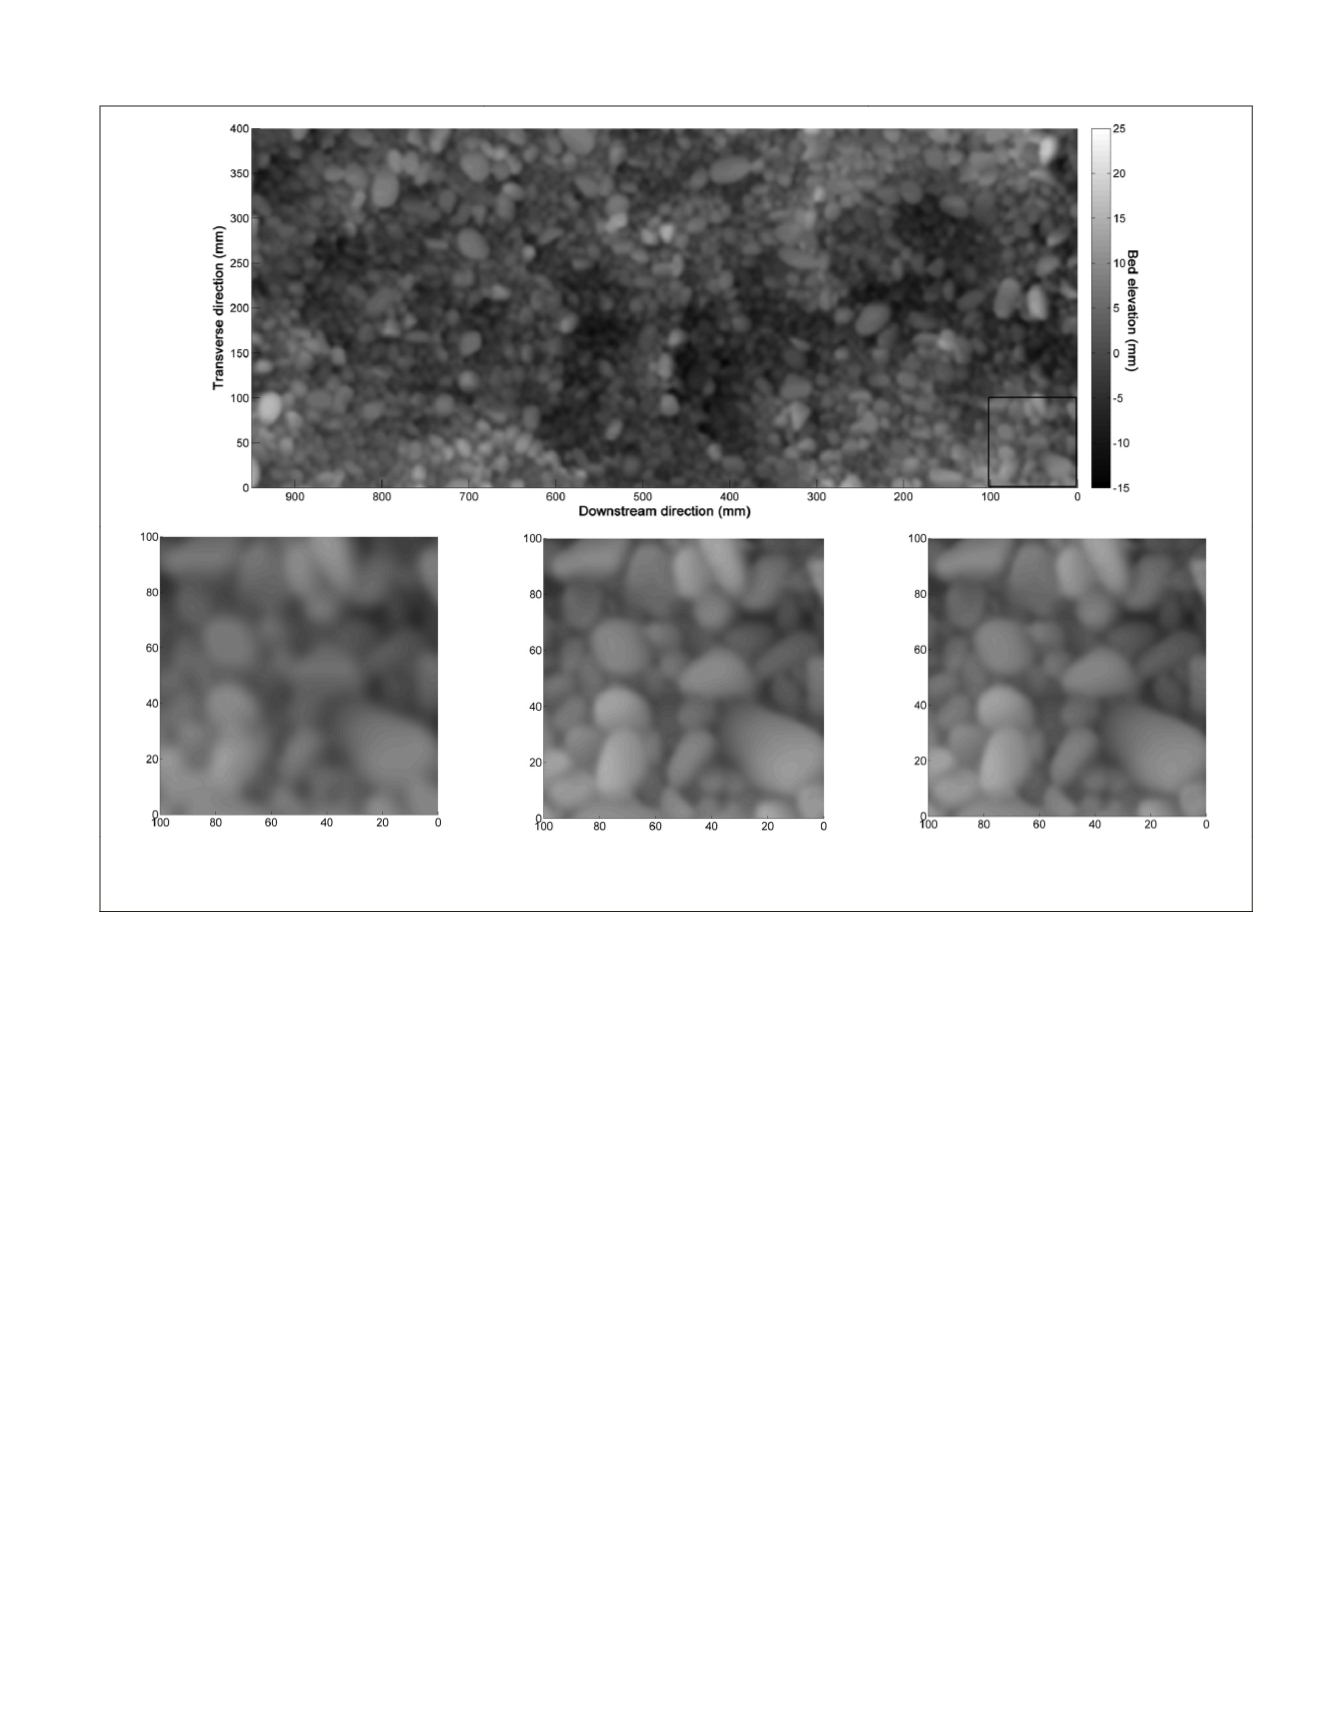
compared to the merged
DEM
(Figure 5). Small gravel particles
are hardly distinguishable in the non-merged
DEM
. It is suited
for general bed-roughness analysis, but analysis on the rela-
tionship between detailed grain roughness and bed roughness
is not possible with the non-merged
DEM
. Visually, no differ-
ences are distinguishable between merged
DEM
s resampled at
0·25 mm and 1 mm, respectively, which agrees well with our
analysis as presented in Figure 4
.
The non-merged
DEM
was compared with the composite
DEM
obtained using merging. No particular trend was observed in the
DEM
of Difference (
DoD
), outside from a reduced sharpness of the
non-merged
DEM
at the edges and gaps between gravel particles.
For this reason, we solely report the results of the quantitative
evaluation. The difference between the two
DEM
s was character-
ized by a
MUE
of 1
·
30 mm and a
SDE
of 1
·
68 mm globally over
the test section. This represents the internal reliability of the
non-merged
DEM
. One can see that
DEM
quality is considerably
degraded compared with the composite
DEM
obtained from the
merging of three individual
DEM
s of better quality
.
The last step in our evaluation of the merging method
examined the effect of scale variation, to simulate the merging
of coarser data with higher uncertainties (e.g., data collected
from aerial platforms). For the tests, the
DEM
s’ sampling
distance was degraded by a factor of 2 and 4, resulting in
new
DEM
grid sizes of 2 mm and 4 mm, respectively. De-
graded
DEM
s were registered and merged the same way as the
original
DEM
s, which were characterized by a 1 mm sampling
distance. The fundamental difference being that the preci-
sion of the horizontal alignment was changed from 1 mm to
2 mm and 4 mm for the two cases studied, respectively, since
the horizontal registration precision equals the
DEM
grid size
(see the “3
D
Co-Registration and Merging” Section). Figure
10 shows the residual maps after co-registration of
DEM
-1 and
DEM
-2, for the two new
DEM
grid sizes. One can see the large
systematic errors resulting from the change in horizontal
registration precision, especially for the 4 mm case. This is
because the position of the stitching line was offset by 1 mm
and 3 mm compared with the optimum position detected us-
ing the 1 mm resolution
DEM
s, for the 2 mm and 4 mm cases,
respectively. Resulting from the inaccurate horizontal align-
ment, seamless merging failed and the residual maps were
characterized by a
MUE
= 1.04 mm (
SDE
= 1.47 mm) and
MUE
= 1.88 mm (
SDE
= 2.47 mm), for the 2 mm and 4 mm cases,
respectively, compared with
MUE
= 0.67 mm (
SDE
= 1.02 mm)
obtained using the original resolution of 1 mm (Figure 7)
.
It is clear that the decision on which
DEM
grid size to
choose (hence on the horizontal alignment precision) is
critical for effective merging. Coarse
DEM
merging can be
improved by resampling the
DEM
s onto finer grids, hence
improving the horizontal alignment precision, before co-
registration. After merging, the unnecessary high-resolution
DEM
can be transformed back to its original sampling dis-
tance. When there is no
a-priori
knowledge of the optimum
registration resolution, this can be determined by error and
trial, until effective seamless merging is achieved. Here, the
degraded
DEM
s characterized by grid spacing of 2 mm and
4 mm, respectively, were resampled onto the original 1 mm
grid, before merging. This enabled detection of the optimum
stitching line, and thus satisfied the condition of seamless
merging (Figure 10).
Figure 9. (Top) DEM of the full test section obtained at once (no merging), represented on a grid with 1 mm spacing; the theoretical depth
resolution is 1·15 mm. (Bottom) Close-ups on bed structure without DEM merging (left); with DEM merging and resampled to 1 mm sam-
pling distance (middle); with DEM merging and 0·25 mm sampling distance (right).
PHOTOGRAMMETRIC ENGINEERING & REMOTE SENSING
January 2016
37


