Integrated DEM Merging Strategy
Adapted Stereo-Photogrammetric Design
In contrast to merging methods used in commercial soft-
ware as standalone tools, an integrated
DEM
merging strategy
requires the identification of the number of
DEM
s needed for
merging and the overlap between individual
DEM
s. Those
two parameters need to be accounted for in the stereo-photo-
grammetric design for optimum results. Assuming the same
area has to be covered, with a need to improve the theoretical
depth resolution from 1.15 mm to less than 0.5 mm to guar-
antee reliable roughness measures, the baseline can be kept
constant, while merging three individual
DEM
s (Table 1)
.
The quality of the merged
DEM
and the process efficiency
are directly affected by the number of individual
DEM
s and
the overlap between them. The existence of an overlap was
already previously shown to be critical to
DEM
merging
(Gallant and Austin, 2009; Streutker
et al
., 2011). Marzahn
et al
. (2012) used an overlap of 30 percent of the size of an
individual
DEM
and our preliminary experiments resulted in
choosing the same value for the present study. We could not
find any other overlap threshold information in the literature.
We found that 30 percent allows for accurate co-registration
of
DEM
s and minimizes the number of
DEM
s to cover the test
section, assuming both requirements are equally important
.
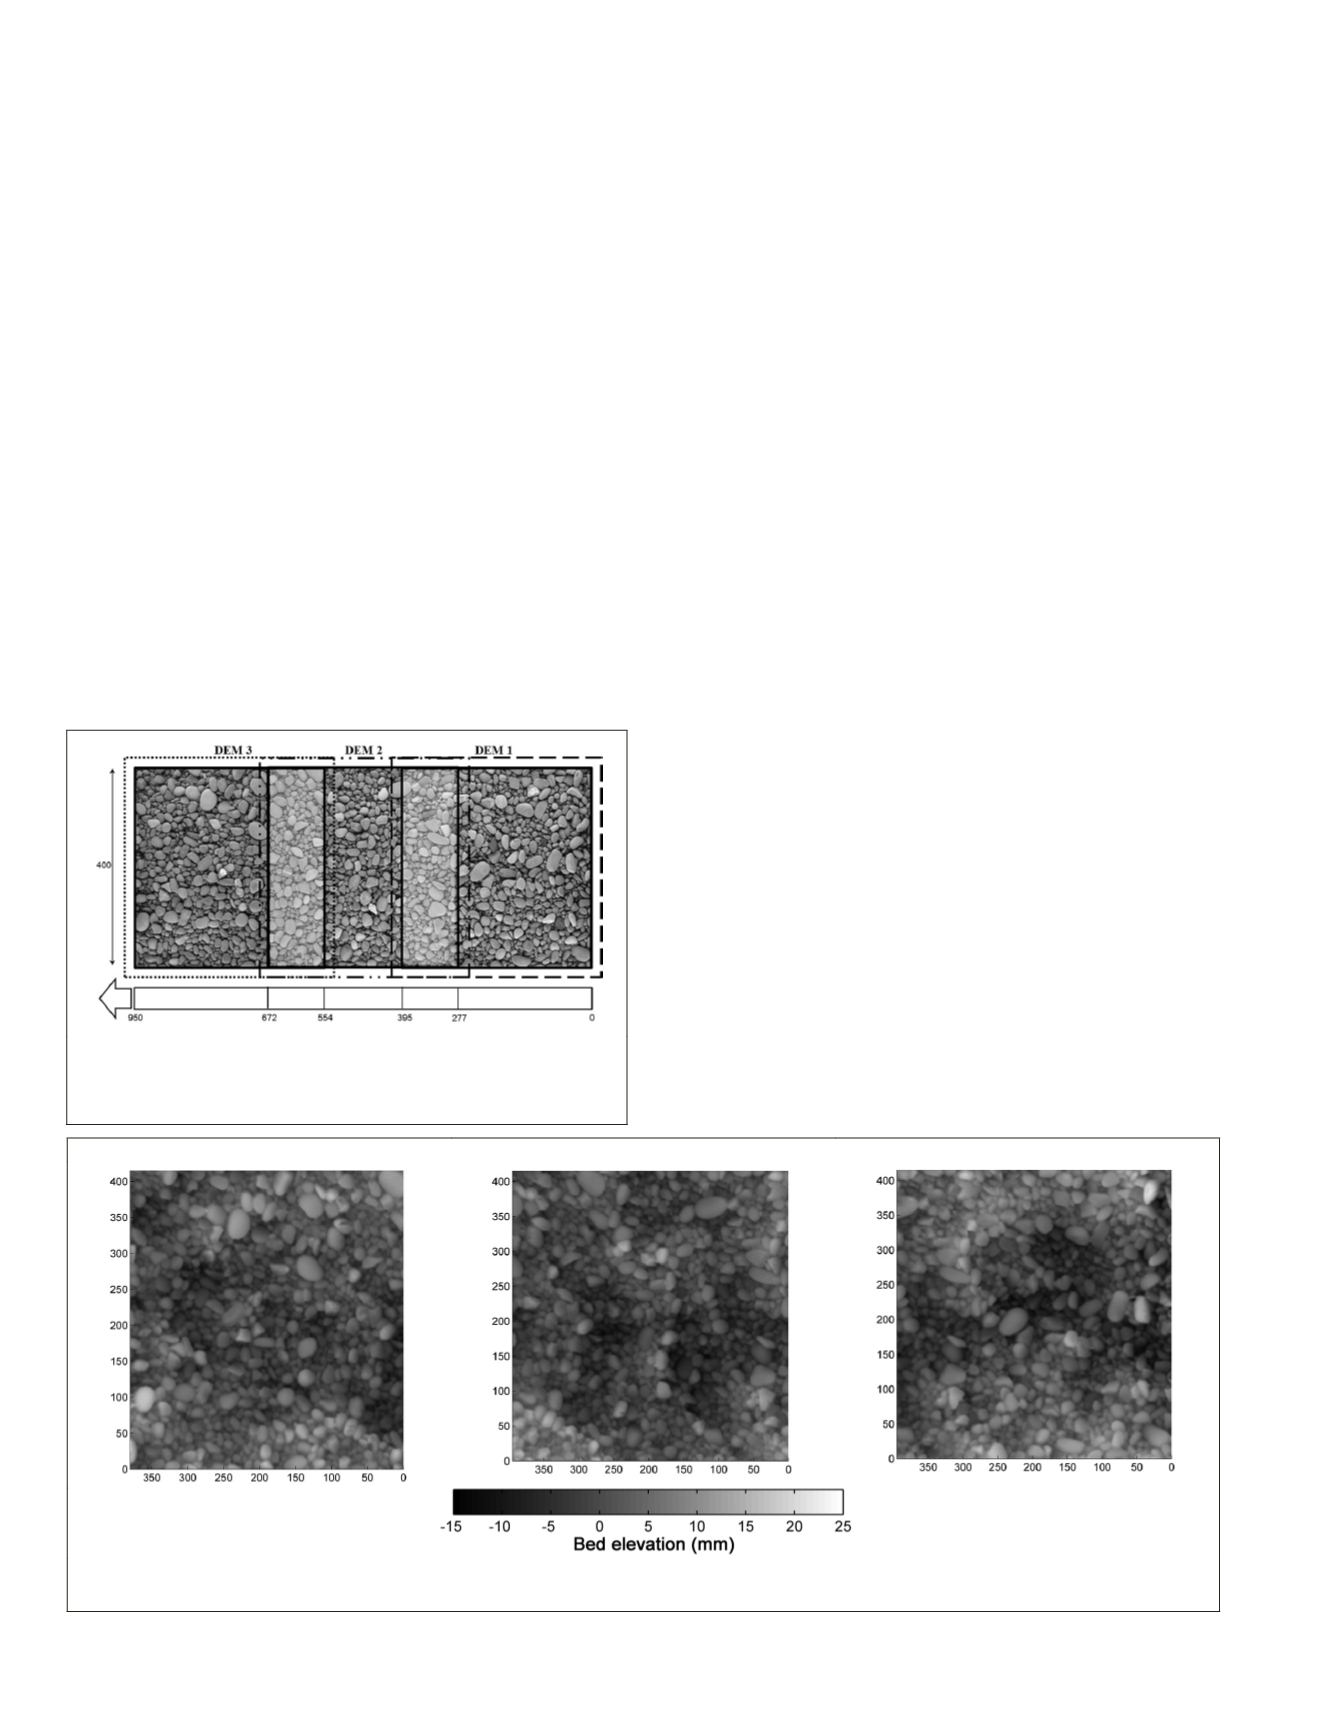
Table 1 summarizes the characteristics of the setup de-
signed to obtain one merged
DEM
of the gravel bed (950 × 400
mm), using three overlapping individual
DEM
s, each with a 5
percent margin. The width of the flume meant that only one
row of
DEM
s was acquired, but the process we present can be
extended to merge
DEM
s in both axes. Based on the design for-
mulae (Equations 1 and 2), the cameras were placed approxi-
mately 581 mm above the test section. The pixel size on the
gravel bed and the theoretical depth resolution were 0.14 and
0.32 mm, respectively (Table 1). Data collection and processing
were similar to the general
DEM
collection workflow, with the
exception that three stereo pairs of the gravel bed were record-
ed and processed. After the acquisition of one stereo pair, the
setup was translated by 277 mm to allow a 30 percent overlap
with the next stereo pair (Figure 2). The individual
DEM
s can
then be interpolated onto a regular grid with 0.14 mm spacing.
3D Co-Registration and Merging
Given two reconstructed overlapping
DEM
s, herewith referred
to as
DEM
-1 and
DEM
-2, the horizontal and vertical shifts
between them are numerically estimated using a self-pro-
grammed MATLAB
®
function. The outcome of the computation
is the line’s coordinates in
DEM
-2 where stitching is to occur
(i.e., at the front of the overlap area), and the bi-linear surface,
which represents the vertical shift between the two
DEM
s
.
To perform the horizontal registration or alignment be-
tween
DEM
-1 and
DEM
-2,
DEM
-2 is moved horizontally with
increments equal to the grid size by means of translations
until best match. Hence, one can see that the horizontal regis-
tration precision depends on the
DEM
resolution. To determine
the best match iteratively and together perform the vertical
registration, the information at the overlap between
DEM
-1 and
DEM
-2 (i.e., the residual map) is utilized to compute by least-
squares the bi-linear surface that represents best the vertical
shift between
DEM
-1 and
DEM
-2. Such a trend can be caused by
a change in orientation of the setup between the acquisitions
of the two
DEM
s (hence a bi-linear surface). Depending on how
the residual map is produced, the calculated trend is then ei-
ther removed or added to
DEM
-2. We propose to use the small-
est mean unsigned (or absolute) error (
MUE
) between the two
DEM
s, after vertical alignment, as the criterion for best match
.
Finally, the areas of
DEM
overlap are averaged. If individual
DEM
s are obtained from the same survey, as is the case for the
present study, we show that standard averaging can be used.
Results
Figure 3 shows three individual
DEM
s, altogether covering the
test section. One can see the overlap between two adjacent
DEM
s, approximately 30 percent the
DEM
size. Using a small
DEM 3
DEM 2
DEM 1
Figure 3. Individual DEMs (395 × 415 mm) after margin removal, altogether covering the entire region of interest. The sampling distance
is 0
·
25 mm and the theoretical depth resolution is 0·32 mm.
Figure 2. Description of the setup, specifically designed to obtain
a merged DEM of size 950 × 400 mm from three individual
DEMs overlapping at 30 percent. The dashed lines indicate the
margin, i.e., at least 5 percent
.
34
January 2016
PHOTOGRAMMETRIC ENGINEERING & REMOTE SENSING


